This US Real Estate Bubble Looks Very Familiar
Housing-Market / US Housing Jan 24, 2018 - 06:39 PM GMTBy: Harry_Dent

 We called the real estate bubble top in late 2005, just before it began to burst in early 2006. So did Jim Stack, a newsletter writer in Whitefish Montana.
Now Jim has a Housing Bubble Bellwether Barometer that’s flashing a sell signal after going up 80% last year. All our alarms are going off as well.
The Confidence Indicator for the National Association of Home Builders/Wells Fargo is at its highest reading in 18 years… higher than it was in early 2006.
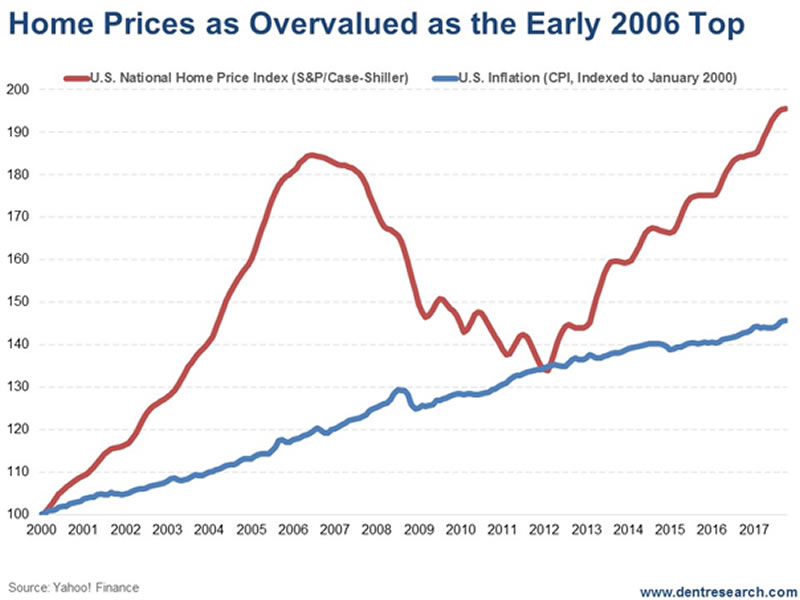
The Case-Shiller National Home Price Index is now higher than the peak in early 2006, and looks like a carbon copy of the last bubble.
All of this is to say: things are looking dangerous in the real estate market!
Look at this chart…

The chart measures home prices versus the CPI (Consumer Price Index). Robert Shiller proved that real estate prices correlate with inflation long term. In fact, Shiller was the only other forecaster (alongside us) who called the housing bubble last time.
In 2017, prices went up 7% while inflation went up 1.9%.
This index is 34.3% above the CPI, almost exactly like the 35% premium in early 2006!
These two bubbles couldn’t be more similar in time frame, overvaluation, and advances if they’d be computer constructed… yet almost no one sees a problem here! When will people ever learn!
Mainstream economists and forecasters are bubble-blind again!
The best sector of the S&P 500 last year was, of course, homebuilders – up 74.8%.
Starter-home companies are doing the best as that’s where the supply is tightest and the demand the strongest.
Yet, home builders have been leaning more towards the high end of the market and aging Baby Boomers for higher profits.
LGI Homes Inc. is a good example of a company that has nailed the low-end markets. It was up a whopping 161% in 2017. The largest homebuilder, D.R. Horton, was up 87% (that could be a great short in the next few months).
But like I said: alarm bells are sounding.
There are two potential “pins” that could trigger a collapse in real estate…
The first is mortgage rates rising from around 4% towards 5%.
The second is the fact that property taxes are no longer deductible. That hurts the bubbliest states like California, New York, and New Jersey.
My bubble model would suggest that home prices go back to their point of origin, at worst, or, most likely 85% of the way. That suggests a loss of 42% to 49%! That’s worse than the 34% crash from 2006 into 2012.
And my model says it should take as long to deflate as it took to build – or about six years or into around 2023, just like last time.
That’s a long way away down!
We’re finalizing a special real estate ebook at this very moment. It contains details of the countries and states most at risk in the bubble… and how much each stands to lose when this situation turns bad. We’ll be sending details about this as soon as its ready, so watch out for that.
Harry
Follow me on Twitter @HarryDentjr
Harry studied economics in college in the ’70s, but found it vague and inconclusive. He became so disillusioned by the state of the profession that he turned his back on it. Instead, he threw himself into the burgeoning New Science of Finance, which married economic research and market research and encompassed identifying and studying demographic trends, business cycles, consumers’ purchasing power and many, many other trends that empowered him to forecast economic and market changes.
Copyright © 2017 Harry Dent- All Rights Reserved Disclaimer: The above is a matter of opinion provided for general information purposes only and is not intended as investment advice. Information and analysis above are derived from sources and utilising methods believed to be reliable, but we cannot accept responsibility for any losses you may incur as a result of this analysis. Individuals should consult with their personal financial advisors.
© 2005-2022 http://www.MarketOracle.co.uk - The Market Oracle is a FREE Daily Financial Markets Analysis & Forecasting online publication.


