


How to Know If This Stock Market Rally Will Continue for Two More Months?
Stock-Markets / Articles Jan 14, 2018 - 05:57 PM GMTBy: Chris_Vermeulen

 Our research has been “spot on” with regards to the markets for the first few weeks of 2018. We issued our first trade on Jan 2nd, plus two very detailed research reports near the end of 2017 and early 2018. We urge you to review these research posts as they tell you exactly what to expect for the first Quarter in 2018.
Continuing this research, we have focused our current effort on the Transportation Index, the US Majors, and the Metals Markets. The Transportation Index has seen an extensive rally (+19.85%) originating near November 2017. This incredible upside move correlates with renewed US Tax policies and Economic increases that are sure to drive the US Equity market higher throughout 2018.
In theory, the Transportation Index is a measure of economic activity as related to the transportation of goods from port to distribution centers and from distribution centers to retail centers. The recent jump in the Transportation Index foretells of strong economic activity within the US for at least the next 3 months.
One could, and likely should watch the Transportation Index for any signs of weakness or contraction which would indicate an economic slowdown about to unfold. In order to better understand how the Transportation Index precedes the US Equity markets by 2~5 months, let’s compare the current price activity to that of 2007~08.
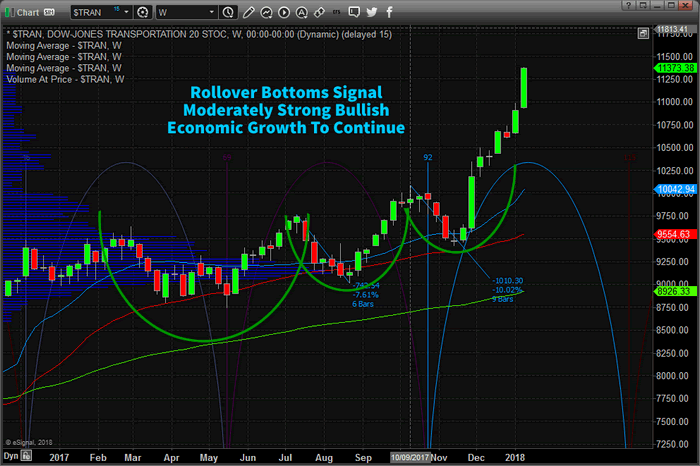
This first chart is the current Transportation Index and shows how strong the US economic recovery is in relation to the previous year (2017). As the US economy has continued to strengthen and open up new opportunities, the Transportation Index has related this strength by increasing by near +20% in only a few short months. This shows us that we should continue to expect a moderate to strong bullish bias for at least the first quarter of 2018 – unless something dramatic changes in relation to economic opportunities.
Current Transportation Index Chart
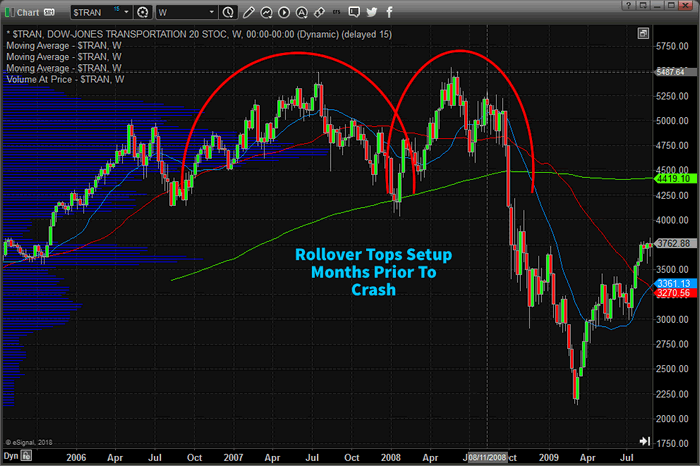
In comparison, this chart (below) is the Transportation Index in 2007~08 which reacted quite differently. The economic environment was vastly different at this time. The US Fed had raised rates consecutively over a two year period leading up to a massive debt/credit crisis. At the same time, the US had a Presidential Election cycle that saw massive uncertainty with regards to regulation, policies and economic opportunities. Delinquencies as related to debt had already started to climb and the markets reacted to the economic alarms ringing from all corners of the globe. The Transportation Index formed a classic “rollover top” formation in late 2007 and early 2008 well before the global markets really began to tank.
2007~08 Transportation Index Chart
Our analysis points to a very strong first quarter of 2018 within the US and for US Equities. We believe the economic indicators will continue to perform well and, at least for the next 3 months, will continue to drive strong equity growth. We do expect some volatility near the end of the first Quarter as well as continued 2~5% price volatility/rotation at times. There will be levels of contraction in the markets that are natural and healthy for this rally. So, be prepared for some rotation that could be deeper than what we have seen over the last 6 months.
In conclusion, equities are this point are overpriced, and overbought based on the short-term analysis. We should be entering slightly weaker time for large-cap stocks over the next couple weeks before it goes much higher. Because we are still in a full out bull market, Dips Should Be Bought and we will notify members of a new trade once we get another one of these setups.
In our next post, we are going to talk about two opportunities in precious metals forming for next week!
Read the analysis we presented before the end of 2017 regarding our predictive modeling systems and how we target our research to helping our members. If you believe our analysis is accurate and timely, then we urge you to subscribe to www.TheTechnicalTraders.com to support our work and to benefit from our signals. We believe 2018 – 2020 will be the years that strategic trades will outperform all other markets. Join us in our efforts to find and execute the best trading opportunities and profit from these fantastic setups.
Visit www.TheTechnicalTraders.com to see what we are offering you.
Chris Vermeulen
www.TheGoldAndOilGuy.com – Daily Market Forecast Video & ETFs
www.ActiveTradingPartners.com – Stock & 3x ETFs
Chris Vermeulen is Founder of the popular trading site TheGoldAndOilGuy.com. There he shares his highly successful, low-risk trading method. For 7 years Chris has been a leader in teaching others to skillfully trade in gold, oil, and silver in both bull and bear markets. Subscribers to his service depend on Chris' uniquely consistent investment opportunities that carry exceptionally low risk and high return.
Disclaimer: Nothing in this report should be construed as a solicitation to buy or sell any securities mentioned. Technical Traders Ltd., its owners and the author of this report are not registered broker-dealers or financial advisors. Before investing in any securities, you should consult with your financial advisor and a registered broker-dealer. Never make an investment based solely on what you read in an online or printed report, including this report, especially if the investment involves a small, thinly-traded company that isn’t well known. Technical Traders Ltd. and the author of this report has been paid by Cardiff Energy Corp. In addition, the author owns shares of Cardiff Energy Corp. and would also benefit from volume and price appreciation of its stock. The information provided here within should not be construed as a financial analysis but rather as an advertisement. The author’s views and opinions regarding the companies featured in reports are his own views and are based on information that he has researched independently and has received, which the author assumes to be reliable. Technical Traders Ltd. and the author of this report do not guarantee the accuracy, completeness, or usefulness of any content of this report, nor its fitness for any particular purpose. Lastly, the author does not guarantee that any of the companies mentioned in the reports will perform as expected, and any comparisons made to other companies may not be valid or come into effect.
Chris Vermeulen Archive |
© 2005-2022 http://www.MarketOracle.co.uk - The Market Oracle is a FREE Daily Financial Markets Analysis & Forecasting online publication.