


Evidence of a Stock Market Top Mounting
Stock-Markets / Stock Market 2017 Dec 10, 2017 - 08:25 PM GMTBy: Andre_Gratian

 Current Position of the Market
SPX: Long-term trend – The bull market is continuing with no sign of a major top in sight.
Intermediate trend – Possible top at 2665.
Analysis of the short-term trend is done on a daily basis with the help of hourly charts. It is an important adjunct to the analysis of daily and weekly charts which discusses the course of longer market trends.
Daily market analysis of the short term trend is reserved for subscribers. If you would like to sign up for a FREE 4-week trial period of daily comments, please let me know at ajg@cybertrails.com
Evidence of a Top Mounting
Market Overview
It is possible that SPX made an intermediate top at 2665 on 12/04 and that the current short-term uptrend from 2625 is a retest of the high, after which the intermediate correction will start in earnest. The rally from 2625 reached 2651 on Friday, and has the potential to go to 2660, and perhaps even 2675 before coming to an end. If only a retest, it would create a double top, after which the index would have to break below 2525 for an initial confirmation that the larger correction has started. A subsequent drop below 2605 would leave little doubt that the bearish clan has finally been able to take control.
The final push to 2665 had all the characteristics of a mini-climax, including the forty-point drop which immediately followed. The current sluggish rally which is at least a test of the highs is also consistent with an important top formation. Not to mention the negative divergence which is now appearing at the weekly and daily time frame. In other words, if you are bullish on the market, it’s time to pay attention to the overwhelming evidence that an important top is being created. Nevertheless, the warning of a top will have to be followed by confirmation that an intermediate decline has begun.
Chart Analysis (These charts and subsequent ones courtesy of QCharts)
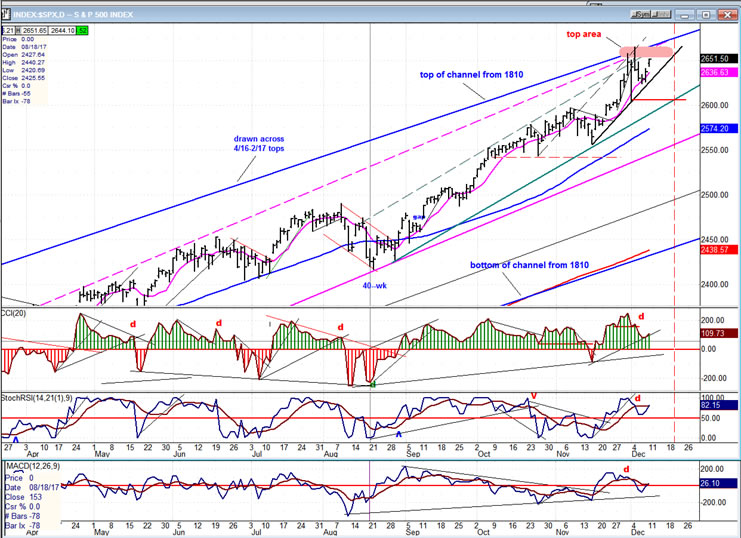
SPX daily chart:
Even with a casual look at this chart, you would have to conclude that the odds favored that a correction of some sort was imminent. With last Monday’s move to 2665, SPX reached the top channel of four distinct price channels of different degrees, which was bound to create some resistance. And if you did not have any more clues, you would have been wise to wait until the price retraced to the bottom of each channel line to see if it held and kept the index in an uptrend, or if it broke and the price moved lower. And you would have had to repeat that verification process as each channel line was reached.
Fortunately, we can do better than that since we have several other technical tools with proven reliability. The simplest ones are the oscillators at the bottom of the chart. As mentioned above, the weekly and daily ones tracking both momentum and breadth are showing negative divergence. This tells us that the correction (when it comes) is likely to last more than a few days -- more like several weeks. In that case, all the above bottom channel lines will fall as the market corrects. In my opinion, even the main channel line from 1810 is likely to be breached.
Beyond channel lines and oscillators, we can also get a good idea of the extent of a trend – before it starts -- by taking a count across the accumulation of distribution phases on our Point & Figure chart. The count taken across the last two accumulation levels (2460 and 2560) pointed to a move to about 2665-2675. The lower level was reached last Monday, and that may be all we get! Therefore, we must now wait for the top distribution pattern to be completed before we can estimate the extent of the coming decline.
Next, there are some fairly important cycles expected to make their lows in January. How much of a drop we can achieve in a month or so, will depend on the size of the distribution area. If you recall, during last August it only took two weeks to correct 60 points. The time frame involved is not as important as the size of the congestion pattern that has been formed. Also, this may be only the first phase of a larger correction.
And, In addition, we are told by the EWT experts that the structural pattern expected to complete in this area calls for fairly large correction afterward. So, with all that evidence accumulating, we should warn that caution is warranted.
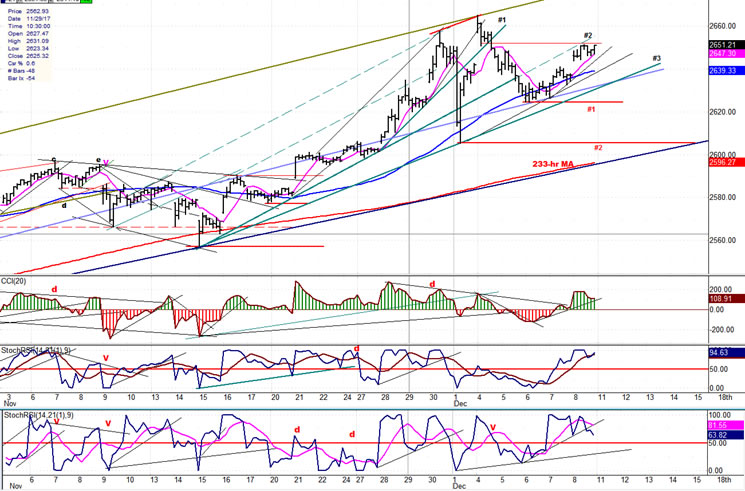
SPX hourly chart:
How will we know that a serious correction has started? When a correction begins, uptrend lines are broken! On the hourly chart, we see that two minor trend lines have already been breached. The third one created support for the pull-back from 2565. If the index does not make a new high and that third trend line is also broken, it is likely that the previous short-term low of 2625 will also be broken. This will reverse the pattern of higher highs – higher lows, to lower highs-lower lows for the first time since 2557, and it will be a good indication that the larger correction is on its way.
But the final confirmation will not come until the 2605 level is also broken. On the chart, we can see that the 233-hr MA matches exactly a larger trend line from 2417. By the time we reach that level, we will have given up at least 60 points, and a combination of a former low plus the trend line/MA should support prices for a little while. Only when that support has given way can we be certain that an intermediate decline has begun, and only then can we get an accurate count of the probable size of the correction.
The recent accumulation at the 2630 line gives us a projection 2660-2675. If the index goes no further than 2665 and turns back down, it would signal that a successful test of the high has been made. I have estimated that the final high (or test of the high), could come on the week of the 18th; but it could come as early as next week, unless we make a new high.
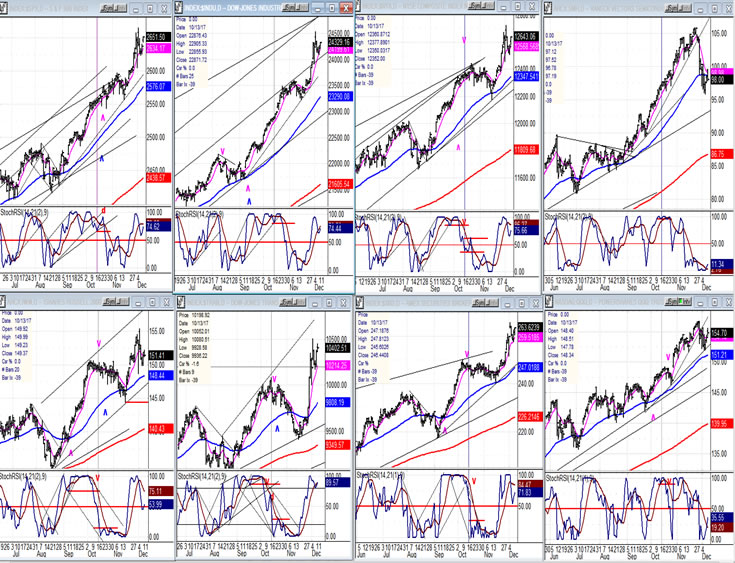
An overview of some important indexes (daily charts)
Looking at the position of the various indexes below, we only have warning signs that we may have a top, but no certainty. Even the index with the most dramatic pull-back (SMH, top right) is still essentially in a higher-high/higher-low pattern. It is clear that only when they start making lower lows, can we can be more confident that a larger correction is taking place. In that context, IWM (bottom left) along with SMH are the indexes to watch since they both had very weak rallies from the intra-week low.
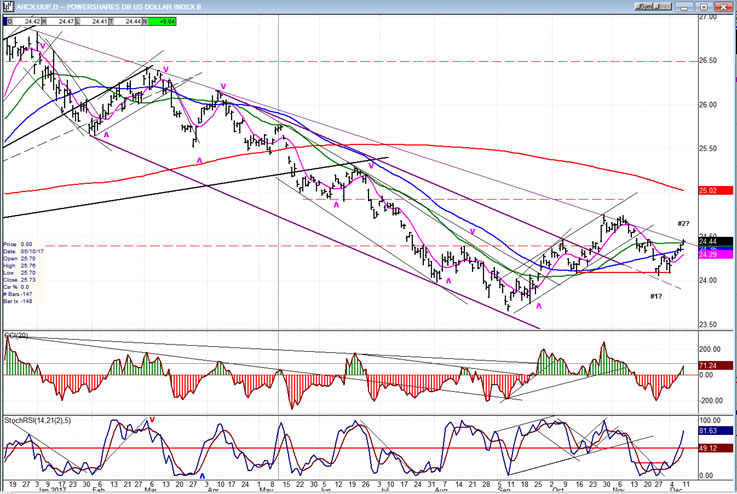
UUP (dollar ETF)
UUP has not yet given up the ghost and is behaving as if it wants to extend its rally from the support level. To do so, it must rise above both its last short-term high and the trend line which arrested its rally a month ago. More time is needed to assess its intention.
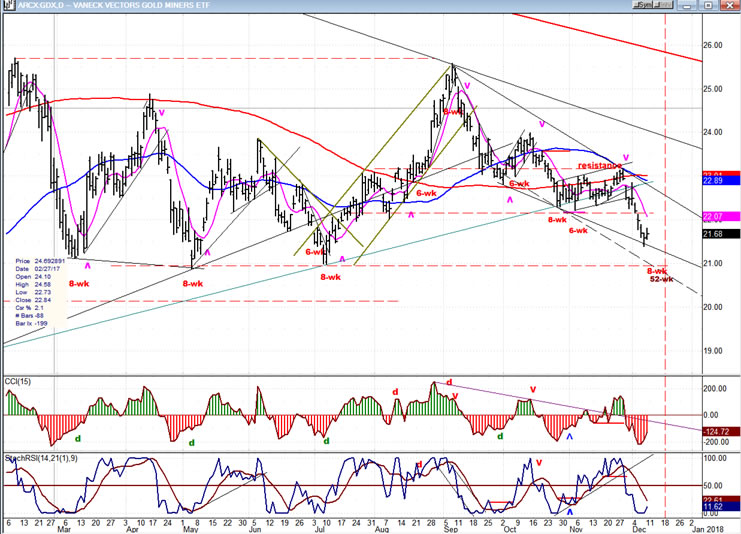
GDX (Gold miners ETF)
GDX continues to conform to its cyclical patterns and has extended its downtrend toward the lows of the cycles shown on the chart. If this continues, it will be ready to reverse in a week to 10 days and begin a new, potentially powerful uptrend.
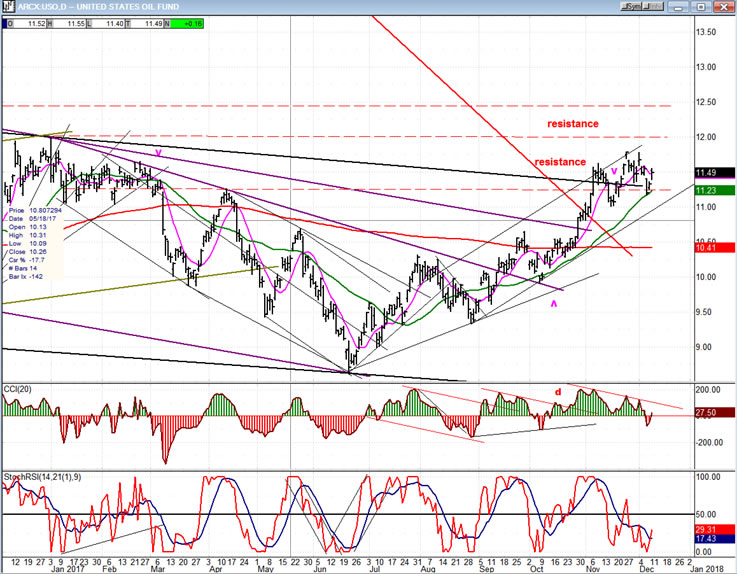
USO (United States Oil Fund)
USO has met with the resistance band caused by the congestion pattern to the left, but it is evident that this hasn’t (so far) caused a serious pull-back, suggesting that a break-out to a new high could soon be in the offing. This would be consistent with a P&F initial target of 12.50-13.00.
Summary
The price action of the past week has added to the perception that SPX is in the process of creating an intermediate top.
Andre
For a FREE 4-week trial, send an email to anvi1962@cableone.net, or go to www.marketurningpoints.com and click on "subscribe". There, you will also find subscription options, payment plans, weekly newsletters, and general information. By clicking on "Free Newsletter" you can get a preview of the latest newsletter which is normally posted on Sunday afternoon (unless it happens to be a 3-day weekend, in which case it could be posted on Monday).
Disclaimer - The above comments about the financial markets are based purely on what I consider to be sound technical analysis principles uncompromised by fundamental considerations. They represent my own opinion and are not meant to be construed as trading or investment advice, but are offered as an analytical point of view which might be of interest to those who follow stock market cycles and technical analysis.
Andre Gratian Archive |
© 2005-2022 http://www.MarketOracle.co.uk - The Market Oracle is a FREE Daily Financial Markets Analysis & Forecasting online publication.