


Signs That This Stocks Bull Market Is On Its Last Leg - Part2
Stock-Markets / Stock Market 2017 Dec 03, 2017 - 02:25 PM GMTBy: Chris_Vermeulen

 In this post we want to share two interesting sets of data that we find are interesting and add to the case of a stock market top is highly likely to take place in 2018. Be sure to read Part I “How to Know When A Bull Market Is About to End”.
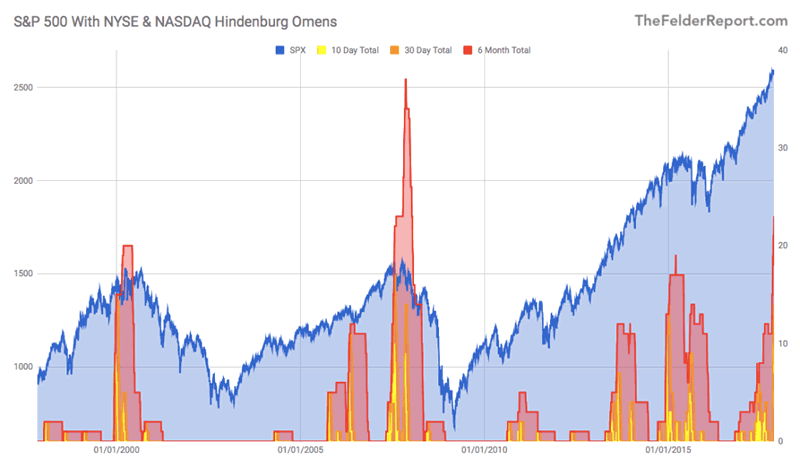
First, let’s take a look at the “Hindenburg Omen” which was developed by Jim Miekka as an early warning of a stock market correction. While it’s not super effective in terms of timing market turns it can be very useful in assessing the overall strength of an uptrend.
The current indicator shows a number of these omens triggered on both the NYSE and the NASDAQ. While the indexes and many of their components have been reaching new highs, an equally large number of components have been making new lows, as well. This suggests that the market is indecisive and probably at a turning point ( the hallmark of a major market peak). Of course, a similar scenario can occur during a falling market when new lows are numerous but new highs begin to rise rapidly. The latter condition would suggest that such market indecision could be an early buy signal in a falling market.
Hindenburg Omens Chart
This chart shows a running total of these omens on the S&P 500 index chart. It is fairly clear that when these flames start rising to levels like they are now, it’s time to start worrying about a correction in the stock market. This indicator does tell us that a bear market is starting by any means, it simply warns us that we should see a decent pulling in price to cleanse/resent the market internals, and investors sentiment.
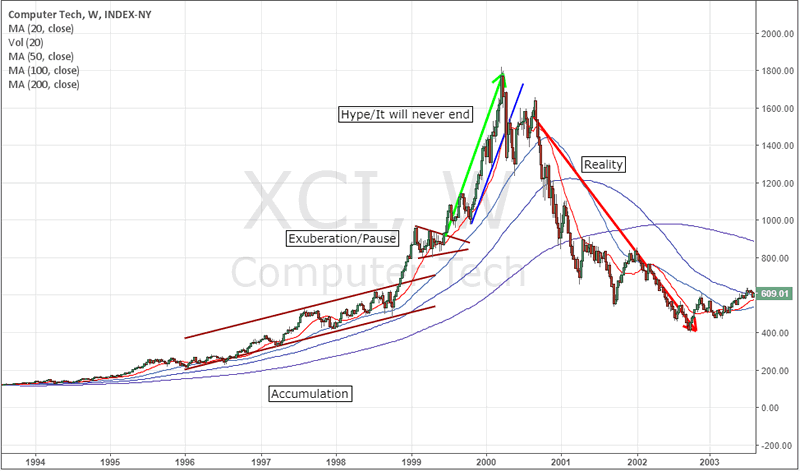
Our second data set we find interesting as it suggests the stock market may be setting up to repeat history in an odd and dangerous manner. As market technicians, part of our job is to work with numbers, find patterns and attempt to predict future price moves in US and Global markets. As you can imagine, it is not always easy to accurately predict the future.
We’ll start by looking at the price activity leading up to the 2000 DOT COM bubble burst. Our analysis focuses on the similarities in price action setting up this price move.
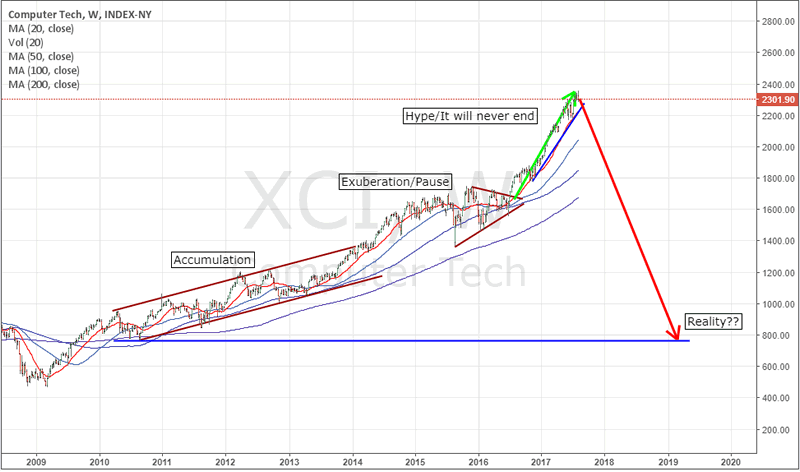
We will let the charts do all the talking as they show the picture clearly.
2000 DOT COM – XCI Index Chart
2017 DOT COM – XCI Index Chart
We have been watching for sings and patiently waiting for the next major market top for over a year. Why? Because once a market top looks to have formed, we must adjust all our long-term portfolio holdings into different asset classes with cash holdings being a huge position.
Stock prices typically fall 7 times faster than they rise so just imagine being properly positioned for a bear market with a portion of your position knowing you could make 7 years of slow painful growth in only 8-14 months when the bear market starts. I recently did a seminar talking about his and how one can use inverse ETF’s and short selling to profit from the next financial downturn, which will eventually happen, and we will be ready for it.
In fact, Bank of America said: “End of bull market coming in 2018”
Bank of America sees a scary good news-bad news scenario unfolding in 2018 with a strong rally higher in the first half of the year followed by all sorts of potential trouble after.
The S&P 500 may top around 2,850 assuming three things: the “last vestiges” of stimulus from the Fed and other central banks, the passage of tax reform in Congress, and “full investor capitulation into risk assets” on better than expected corporate earnings.
After that, things get considerably sketchy as the second-longest bull market in history starts to run into trouble.
“We believe the air in risk assets is getting thinner and thinner, but the Big Top in price is still ahead of us,” Michael Hartnett – Bank of America
Conclusion:
In short, investors continue to pile into equities and buying into every little dip I price that takes place. Its just a matter of time now before the majority of investors have placed all their extra capital into the stock market, and once the level is reached, is when the market will put in a top and hurt the greatest number of investors possible, just like it has done with every other bull and bear market cycle in history.
There will be several great trading opportunities for both short-term traders and long-term investors, which we will share with our subscribers as the market evolves and new strategies must be implemented.
Take advantage of 53+ years of combined trading experience and follow our trades and investment portfolios today!
If you want to learn more about how we can assist you with your investment needs, visit www.TheTechnicalTraders.com to learn more. Our researchers are dedicated to assisting you and in helping you learn to profit from these moves. 2018 is certain to be a dynamic trading year – so don’t miss out.
These moves could be explosive and we want to assist you in profiting from them with our advanced research and technology. Check out www.ActiveTradingPartners.com today to learn more.
Chris Vermeulen
www.TheGoldAndOilGuy.com – Daily Market Forecast Video & ETFs
www.ActiveTradingPartners.com – Stock & 3x ETFs
Chris Vermeulen is Founder of the popular trading site TheGoldAndOilGuy.com. There he shares his highly successful, low-risk trading method. For 7 years Chris has been a leader in teaching others to skillfully trade in gold, oil, and silver in both bull and bear markets. Subscribers to his service depend on Chris' uniquely consistent investment opportunities that carry exceptionally low risk and high return.
Disclaimer: Nothing in this report should be construed as a solicitation to buy or sell any securities mentioned. Technical Traders Ltd., its owners and the author of this report are not registered broker-dealers or financial advisors. Before investing in any securities, you should consult with your financial advisor and a registered broker-dealer. Never make an investment based solely on what you read in an online or printed report, including this report, especially if the investment involves a small, thinly-traded company that isn’t well known. Technical Traders Ltd. and the author of this report has been paid by Cardiff Energy Corp. In addition, the author owns shares of Cardiff Energy Corp. and would also benefit from volume and price appreciation of its stock. The information provided here within should not be construed as a financial analysis but rather as an advertisement. The author’s views and opinions regarding the companies featured in reports are his own views and are based on information that he has researched independently and has received, which the author assumes to be reliable. Technical Traders Ltd. and the author of this report do not guarantee the accuracy, completeness, or usefulness of any content of this report, nor its fitness for any particular purpose. Lastly, the author does not guarantee that any of the companies mentioned in the reports will perform as expected, and any comparisons made to other companies may not be valid or come into effect.
Chris Vermeulen Archive |
© 2005-2022 http://www.MarketOracle.co.uk - The Market Oracle is a FREE Daily Financial Markets Analysis & Forecasting online publication.