


Forecasting US 30-Year Treasury Bond Yields
Interest-Rates / US Bonds Sep 07, 2017 - 08:04 PM GMTBy: Francois_Soto

 The movement of interest rates affects lenders and creditors across global markets while influencing key variables such as output, employment, etc.
We predict the US Generic 30-Year Treasuries Yield using a selection of macroeconomic variables chosen from hundreds of time series available.
We trade US1 future contracts based on the differential between the regression output and the actual yield and this strategy is profitable.
Interest rates are an important monetary policy tool to gauge the state of the economy and for policy makers to act accordingly. Per its definition, it is the rate at which interest is paid by a borrower for the use of money. The movement of interest rates affects lenders and creditors across global markets while influencing key variables such as output, employment, consumption, etc.
In this piece, we attempt to forecast US Long-Term Treasury Yields. The dependent variable under observation is the US Generic 30-Year Treasuries Yield, which can be traded indirectly with US1 future contracts. We explain each step to create a factor-based model using macroeconomic variables. We then illustrate how the output can be turned into actionable advice.
Based on research from the academic literature and hundreds of time series available, we retain ten macroeconomic factors as being potential leading indicators of US 30-Year Treasuries. The symbol in the bracket is an internal abbreviation of the factor that will be used subsequently to ease readability. Please take note we won’t discuss adjustments of time series in this piece.
CRB All Commodities [CRBA]
It includes energy, metal and agricultural commodities. In the current environment, lower commodity prices mean more discretionary income for U.S. consumers as they usually act as an indirect tax levy. Therefore, improved economic conditions eventually triggers rates to go higher.
Source: Thomson Reuters
FAO Agricultural Price [AGRI]
AGRI measures the international price change of a basket of five food related commodity groups across the world. The index was created by the Food and Agriculture Organization of the United Nations. This variable behaves in the same way as the CRB All Commodities Index relative to interest rates.
Source: FAO.org
PPI Foodstuff & Feedstuff [PPIF]
This indicator measures the change of prices received by domestic producers of the food industry. It considers three levels of demand: commodity, within industry and final demand for the product. This variable behaves in the same way as the CRB All Commodities Index relative to interest rates.
Source: Federal Reserve
Free Credit Balance [FREE]
The amount of money free from withdrawal restrictions that remains after all securities purchases, margin requirements, short sale proceeds and special considerations. An increase of this amount usually means market participants are becoming risk averse, which means lower rates ahead.
Source: FINRA.org
Emerging Markets [EMER]
21 emerging economies with intermediate income, catching-up growth, institutional transformations and economic opening. Because they are significant US export trade partners, they tend to have an indirect influence over interest rates via the base material / commodities trade.
Source: MSCI
Convertibles Arbitrage [CONV]
Market-neutral investment strategy employed by fixed-income hedge funds. Convertibles are sometimes priced inefficiently due to various reasons such as illiquidity or psychology. They exploit these inefficiencies on various fixed-income instruments which can offer a forward guidance.
Source: Hedge Fund Research
Used Vehicle Value [MUVV]
The Manheim Used Vehicle Value Index is a monthly indicator that calculates the value of more than 5 million used car transactions split into 20 market classes every year. It takes into consideration the average price and average mileage for each model / year / make / trim and excludes outliers.
Source: Manheim
First Year IPO [FIPO]
The Bloomberg IPO Index tracks the first-year performance of IPOs on the secondary market. Companies can raise money either with equity or debt. Usually, we tend to see higher IPOs when the US economy is in its late stage. Higher delinquencies usually mean lower interest rates in the long run.
Source: Bloomberg
Mortgage Loans [MORT]
This corresponds to the total amount of mortgage debt outstanding in the US expressed in a Year Over Year basis. Mortgage loans are crucial to explaining long rates. As debt leveraging increases, so does the associated credit risk. The additional risk is eventually reflected with higher interest rates.
Source: Federal Reserve
MBA Purchase Index [MBAP]
The Mortgage Bankers Association’s Index is a nationwide home loan application measurement that covers about 75% of the US mortgage activity. This leading indicator seems to be a predictor of interest rates over the last years, specially following the sub-prime mortgage meltdown.
Source: Mortgage Bankers Association
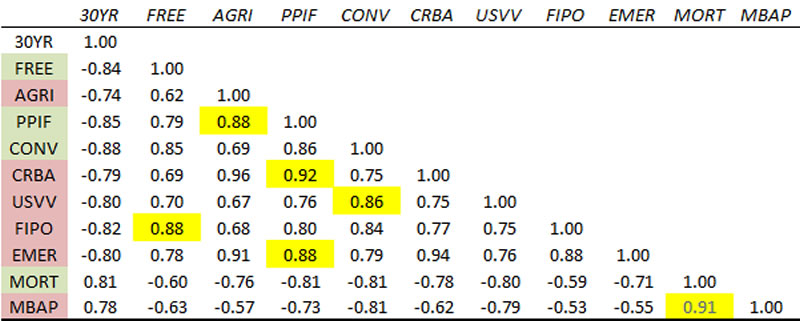
Now that our variables are defined, we will calculate a correlation matrix to discard variables that may create multicollinearity. Because AGRI, CRBA, PPIF and EMER are all somewhat linked to inflation, they are highly correlated, we will only keep PPIF. Between FREE vs. FIPO, we keep FREE and between MORT vs. MBAP we keep MORT. We are left with only four independent variables.
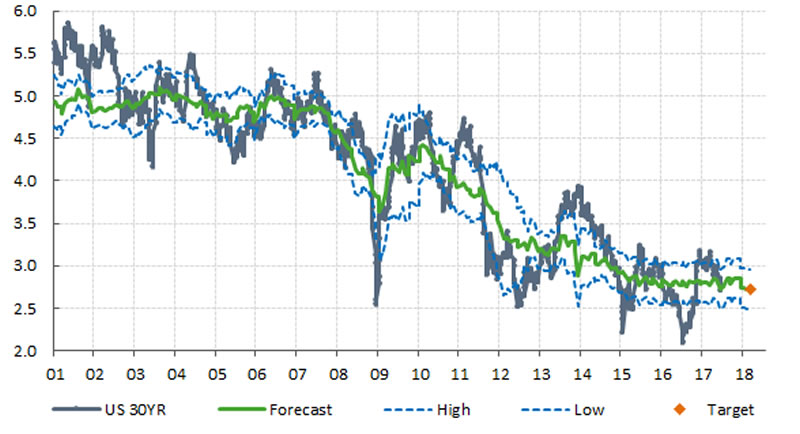
The four variables are FREE, PPIF, CONV and MORT. We calculate a multiple regression and we end up with this equation: 30YR = 4.35 – 0.50 FREE – 0.15 PPIF – 0.20 CONV + 0.24 MORT. If you look at the chart below, the multiple regression is shown in green, an upper / lower band of one standard deviation in light blue and our 30-Year Treasuries yield target of 2.7% in orange.
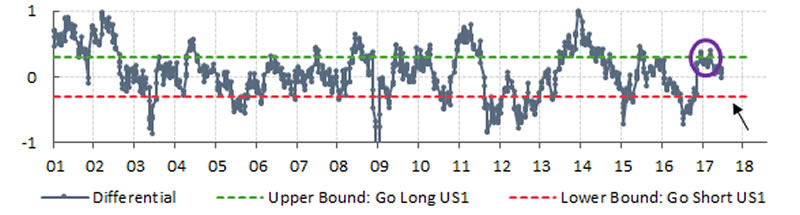
The regression is the theoretical price at which the long-term yield should be trading and the actual price includes a sentiment component. One way to use this information is to take positions in US1 future contracts whenever the differential between the Theoretical Price – Actual Price reaches an extreme level. The indicator below is the differential between two extreme boundaries.
The last extreme level occurred on December 9th, 2017 (purple circle). The indicator hinted US1 Long-Term bonds are very cheap and a reversal might follow. Therefore, the model went long US1 future contracts at that time. The large profits from this position are still unrealized as we are waiting for the differential to reach the opposite extreme later this year or possibly in 2018.
The simulation of this US Long-Term Bond Model realized a strong PnL curve (see below). The US1 Signal refers to the position taken by the model: +1 = Long and -1 = Short. At the time of writing, the model still recommends investors to be long US1. A short position will only be initiated when the differential goes to the opposite extreme (see arrow on the previous chart).
In conclusion, we predicted the US 30-Year Treasuries Yield with a multiple regression using four variables. This model most likely needs to be revised on a yearly basis to adjust coefficients and monitor that a significant regime change didn’t create a material impact on the model. The differential can be used as a contrarian indicator when extremes are reached as we have shown.
By François Soto CFA, MBA, FRM, CIM
www.inovestor.am Vice-President, Portfolio Management
François Soto is Inovestor Asset Management’s Vice-President and Portfolio Manager. He is leading the investment process for Canadian, US and Global equities while also overseeing the financial research department. Before joining the firm, François accumulated 10 years of experience working for various financial institutions. François holds a MBA degree specializing in Finance from HEC Montreal (2011) and is a CFA charterholder (2016), a FRM charterholder (2010) and a CIM charterholder (2010).
© 2017 François Soto. All rights reserved. Disclaimer: The above is a matter of opinion provided for general information purposes only and is not intended as investment advice. Information and analysis above are derived from sources and utilising methods believed to be reliable, but we cannot accept responsibility for any losses you may incur as a result of this analysis. Individuals should consult with their personal financial advisors.
© 2005-2022 http://www.MarketOracle.co.uk - The Market Oracle is a FREE Daily Financial Markets Analysis & Forecasting online publication.