Stock Market SPX : Morphology 101
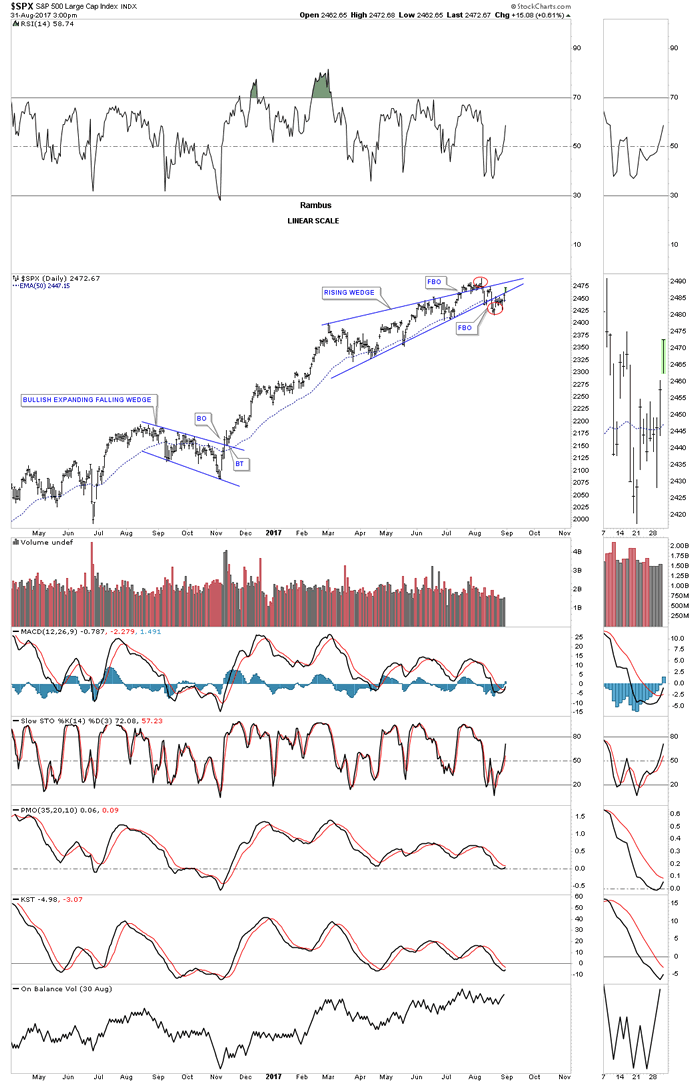
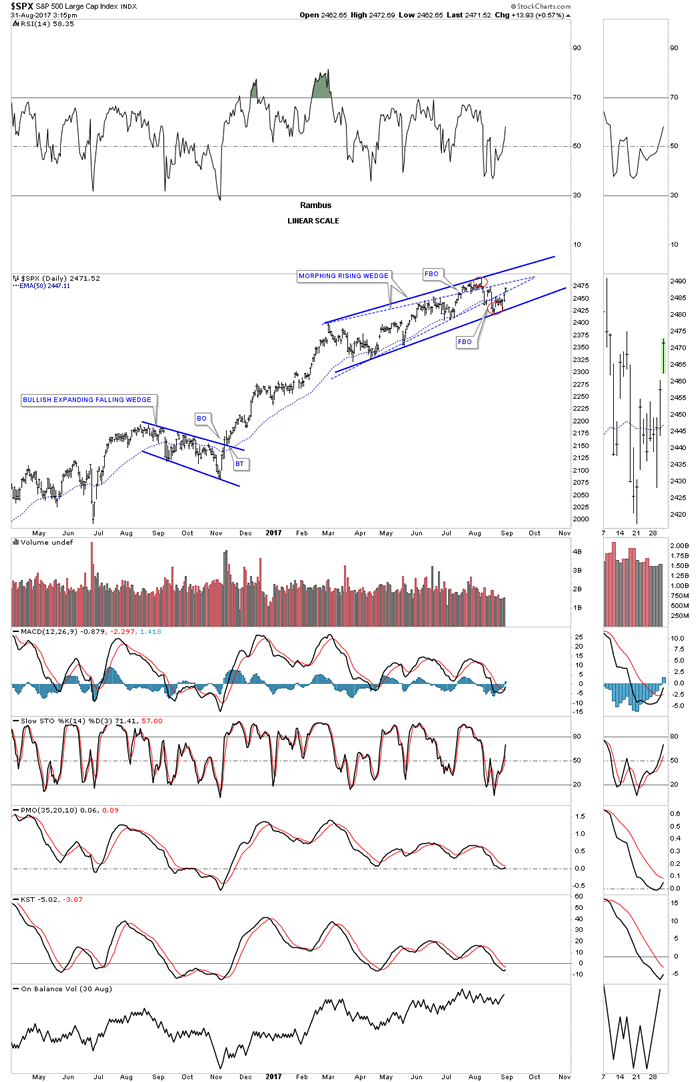
Stock-Markets / Stock Market 2017 Sep 01, 2017 - 12:36 PM GMT Below is a daily chart for the SPX which shows you a good example of a morphing rising wedge. As you can see there was a false breakout above the top rail and then an equal false breakout below the bottom rail, symmetry false breakouts, red circles.
When that occurs we need to adjust the top and bottom trendliness to the new high and low to get the new pattern. The original rising wedge is now shown by the blue dashed trendlines with the new rising wedge the solid blue trendlines.

If the price action breaks out above the new top rail we’ll have a bullish rising wedge that has been in consolidation mode going back to February which is a nice amount of time for a consolidation pattern to develop for this type of move. On the other hand if the price action breaks below the bottom rail then we’ll have a bearish rising wedge. My experience has been that the original pattern is the correct pattern with the morphing process just making the pattern a little bit bigger.
Also keep in mind this rising wedge could be a halfway pattern to the upside if we get the breakout above the top rail. Also these types of patterns that slope up in the direction of the trend tells us the impulse move is very strong. So we wait for confirmation one way or the other.

All the best
Gary (for Rambus Chartology)
FREE TRIAL - http://rambus1.com/?page_id=10
© 2017 Copyright Rambus- All Rights Reserved
Disclaimer: The above is a matter of opinion provided for general information purposes only and is not intended as investment advice. Information and analysis above are derived from sources and utilising methods believed to be reliable, but we cannot accept responsibility for any losses you may incur as a result of this analysis. Individuals should consult with their personal financial advisors.
© 2005-2022 http://www.MarketOracle.co.uk - The Market Oracle is a FREE Daily Financial Markets Analysis & Forecasting online publication.


