S&P 500 Pushing the Envelope - Stock Market Crash 2017
Stock-Markets / Stock Market 2017 Jul 24, 2017 - 02:18 PM GMTBy: Submissions
Rajveer Rawlin writes: Looking at the weekly close on the S and p 500 since 1950 its average close stands at 522 while the standard deviation stands at 606. One of the few markets in the world where the standard deviation exceeds the mean. This is also true with other US Indices like the Dow and the Nasdaq but is not the case with Emerging markets. This has been the case with US markets since 1998 when the FED intervened in the market to bail out the failing LTCM. Subsequent Fed intervention has caused the risk in the market to go up and not come down.
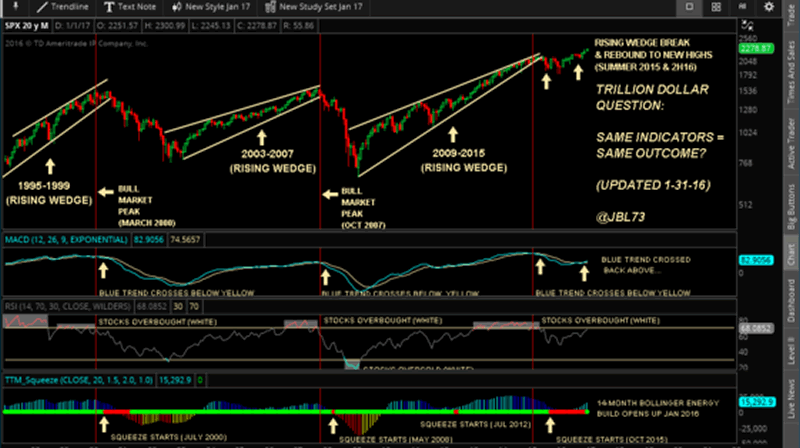
Taking this a step further looking at where we are now we are sitting at well over 3 standard deviations over the mean. Earlier situations like this produced corrections in excess of 15%. Lets take a look at some of them:

| Time | Standard Deviations above Mean | %Loss from Top |
| August 1987 | 4.57 | 33% |
| July 1998 | 4.93 | 18% |
| March 2000 | 4.63 | 26% |
| May 2001 | 3.20 | 25% |
| October 2007 | 2.84 | 56% |
| July 2015 | 3.04 | 16% |
This is not to say the markets will start crashing tomorrow but given the insane valuations and the fact that we have not visited the long term average on the S and P 500 which stands at 522 since 1974, the risks are out there!
By Rajveer Rawlin
http://rajveersmarketviews.blogspot.in
© 2017 Copyright Rajveer Rawlin - All Rights Reserved
Disclaimer: The above is a matter of opinion provided for general information purposes only and is not intended as investment advice. Information and analysis above are derived from sources and utilising methods believed to be reliable, but we cannot accept responsibility for any losses you may incur as a result of this analysis. Individuals should consult with their personal financial advisors.
© 2005-2022 http://www.MarketOracle.co.uk - The Market Oracle is a FREE Daily Financial Markets Analysis & Forecasting online publication.


