


We Will Face The Greatest Stock Market Turning Point In October- Beware!
Stock-Markets / Stock Market 2017 Jul 19, 2017 - 03:06 AM GMTBy: Harry_Dent

 Normally the worst season for the stock market is between July and November, especially August through mid-October, with September the worst month for losses (on average, of course).
The first wave of the 1929 to 1932 crash ran from early September into mid-November, claiming a loss of 47% in just two and a half months.
This year, this time frame could be equally dangerous…
I’m a long-term forecaster, so I look to Andrew Pancholi at markettimingreport.com to fine tune the shorter-term situation. That’s not an easy task. And it’s impossible to be right all of the time. If you can nail short-term forecasts about 60% or 70% of the time, you’re a hero in this realm!
Andy has some very impressive long-term cycles, as attendees of our Palm Beach Irrational Economics Summit last October learned. But he also has some impressive shorter-term models that show some major turning points over the next few years.
A turning point can go either direction. Andy can only give an estimate of whether we’ll see a boom or a bust as the date approaches.
To date, he’s been eerily accurate!
Now, guess what?
The strongest spike for a turn point hits in October!
This is the biggest spike he’s seen over more than 20 years, and from his models, looks to be the biggest one we’ll see during the next 10.
His weekly models point specifically to around October 20.
Both of us believe that could be the top of the greatest bubble in history.
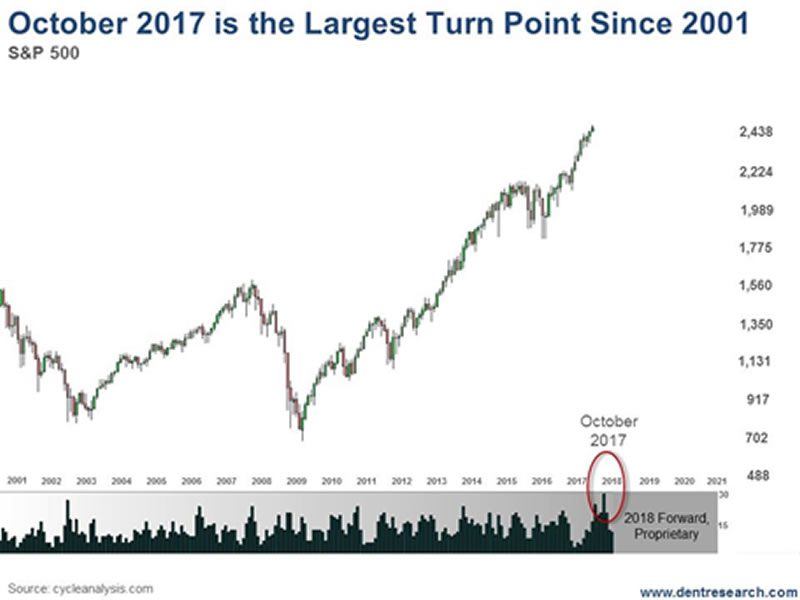
His second greatest spike of the last few decades came in late 2002, right near the bottom of the great tech wreck crash.
Andy also sees possible turning points later this month and in late January 2018.
The most likely scenario at this point – and Andy and I will continue to reevaluate as it develops – is that we see an intermediate top in the stock markets by the end of the third week of this month, with a 5% to 10% crash into late August or early September. Then we get a final bubble run into mid- to late October followed by the classic bubble burst of 30% to 50% within two to three months, into January or so.
The question is, what will be the trigger of these events? I tackle this question in the latest issue of Boom & Bust. I also look at the role President Donald Trump plays in this rally, and its inevitable reversal… the shocking shift we’re about to see in employment numbers and what that could mean for the stock market… and the biggest danger facing Europe right now.
Then our model portfolio manager, Charles Sizemore, adds a new recommendation this month to take advantage of the deflationary environment ahead.
A major peak finally looks imminent after Janet Yellen’s statement that “we won’t see another financial crisis in our lifetime.” And now Alan Greenspan has added that he doesn’t see signs of irrational exuberance… like a market that believes Trump is going to wave a magic wand and create 4% growth again isn’t irrational?! Like 29-times cyclically adjusted earnings, headed for 32 as in 1929, isn’t overvalued?!
Our experts suffer from the typical human condition: The more a trend goes up, the more we believe in it and see less risk. History has proved time and again that this view of the way of things are is always to our detriment.
This bubble looks to be in its final stages. A divergence between small and large cap stocks after the next correction will be the best confirmation.
Keep reading.
Harry
Follow me on Twitter @HarryDentjr
Harry studied economics in college in the ’70s, but found it vague and inconclusive. He became so disillusioned by the state of the profession that he turned his back on it. Instead, he threw himself into the burgeoning New Science of Finance, which married economic research and market research and encompassed identifying and studying demographic trends, business cycles, consumers’ purchasing power and many, many other trends that empowered him to forecast economic and market changes.
Copyright © 2017 Harry Dent- All Rights Reserved Disclaimer: The above is a matter of opinion provided for general information purposes only and is not intended as investment advice. Information and analysis above are derived from sources and utilising methods believed to be reliable, but we cannot accept responsibility for any losses you may incur as a result of this analysis. Individuals should consult with their personal financial advisors.
© 2005-2022 http://www.MarketOracle.co.uk - The Market Oracle is a FREE Daily Financial Markets Analysis & Forecasting online publication.