


NDX/NAZ Continue downward pressure on the US Stock Market
Stock-Markets / Stock Market 2017 Jun 18, 2017 - 10:16 AM GMTBy: Tony_Caldaro

 The week started at SPX 2432. After a decline to SPX 2420 on Monday the market rallied to 2444 by Wednesday. The market dropped to SPX 2419 on Thursday, then rallied to 2433 to end the week. For the week the SPX/DOW gained 0.3%, and the NDX/NAZ lost 1.0%. Economic reports continue to be weak. On the downtick: retail sales, the CPI, business inventories, import prices, the Philly FED, capacity utilization, the NAHB, housing starts, building permits, consumer sentiment, the Q2 GDP estimate, the WLEI, and the budget deficit widened. On the uptick: the NY FED and jobless claims improved. Next week’s reports will be highlighted by leading indicators and more housing.
LONG TERM: uptrend
The long-term wave count we have been tracking had remained unchanged for about a year. There will probably be some minor adjustments as time goes on: project-monitor-adjust. Overall, however, we do expect this to continue to least 2018 and possibly 2020. The longer-term pattern appears more and more probable into the foreseeable future. More on this in a soon to be released special report.
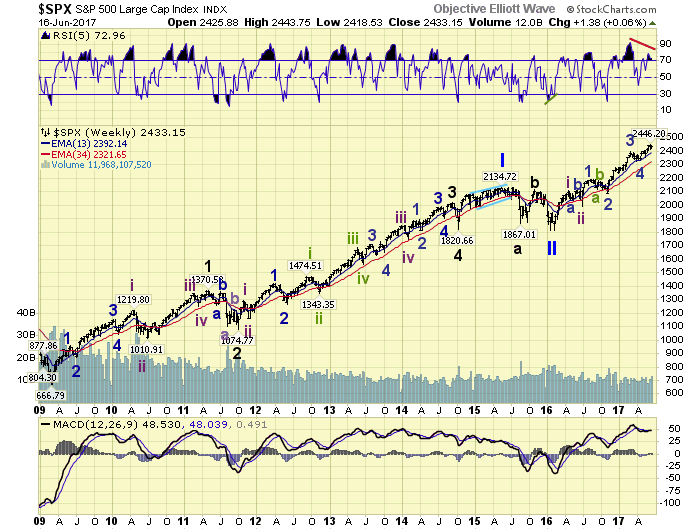
We continue to label the SPX 667 low in 2009 as the end of Super cycle wave 2. Suggesting a Super cycle wave 3, multi-generational bull market began at that time. Primary wave I, of the first of five Cycles waves, began at that time and concluded in 2015 at SPX 2135. Then after a short and swift bear market Primary II bottomed at SPX 1810 in 2016. A Primary wave III bull market began at that time. Currently the market is rising in Major wave 1 of that Primary III. And, if our estimates are correct for SPX 3000+, it appears to be about halfway done at this point in time.
MEDIUM TERM: uptrend may have topped
The NDX/NAZ, which have been leading the SPX/DOW higher in recent months, display indications that their 7-month, 13-wave uptrend may have recently ended. Should this be the case the downside pressure created should eventually pull the general market down as well. The NAZ in particular has a fairly uniform pattern since 2016.
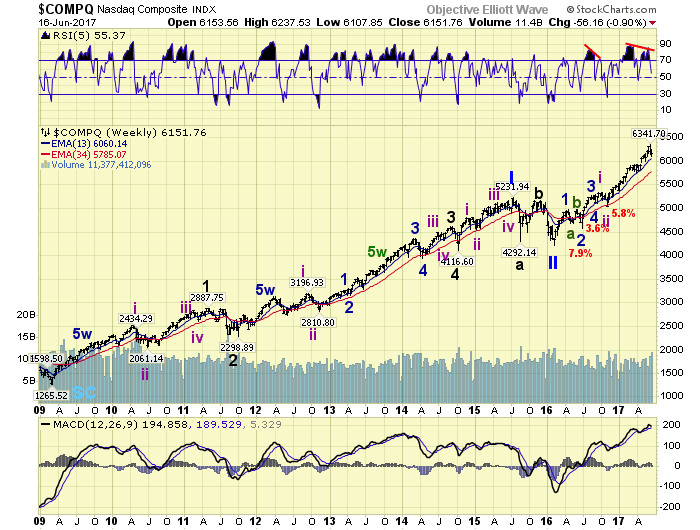
It advanced in 13-waves, 5-trends, 1100+ points over 7-months to complete its Intermediate wave i. Then after a 2-month decline, where it lost 5.8%, it ended Int. wave ii. After that it rallied in 13-waves, one trend, 1300+ points over 7-months for Int. iii.
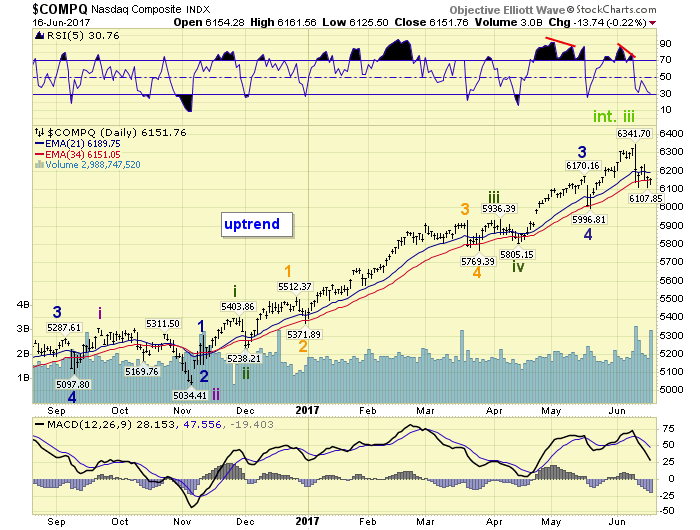
After last week’s selloff it has rebounded then consolidated into this week’s options expiration. The weekly RSI is displaying a negative divergence, just like it did at the end of Int. i. And, there has been relatively heavy volume during the recent decline. A correction down to NAZ 5900-6000 would not surprise at this time
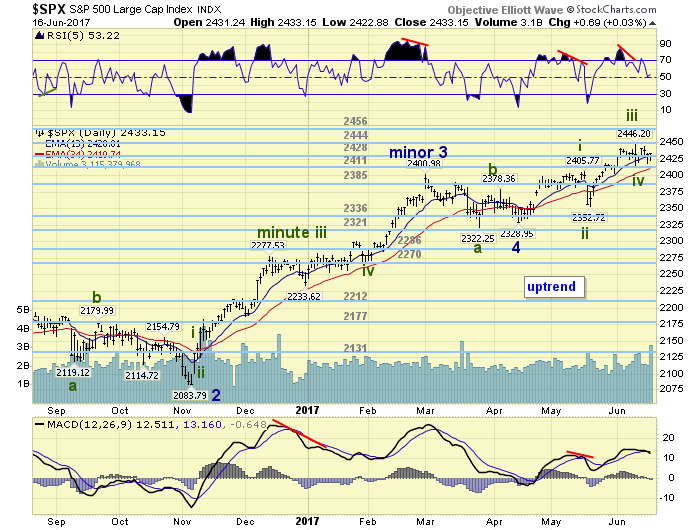
The SPX has been rising in five Minute waves from its recent downtrend low at 2329 in mid-April. Different count than the NDX/NAZ but both leading to a potential Int. iii conclusion. Minute waves i thru iv have completed: 2406-2353-2446-2416. And, Minute wave v may have already completed this week with a slight failure at 2444. A negative RSI divergence appears on this chart as well. Medium term support is at the 2428 and 2411 pivots, with resistance at the 2444 and 2456 pivots.
SHORT TERM
While Minute i advanced in five Micro waves as displayed in orange on the chart. Minute iii also advanced in five waves, but on a much smaller scale: 2419-2404-2440-2425-2446. Then the decline for Minute iv to SPX 2416, set up the recent rally to 2444, decline to 2419, then rally to 2434. Minute wave iv triangle underway? Or a failed Minute v at SPX 2444?
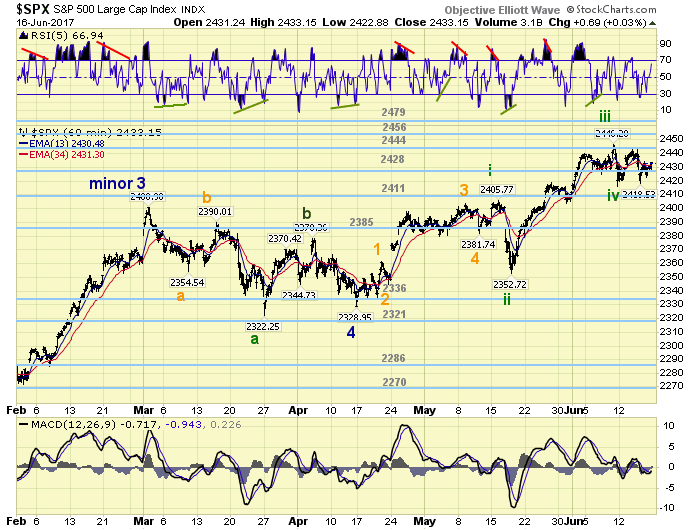
Either way we have some important levels to watch. For a breakout to continue the uptrend SPX 2444 and 2446. For a breakdown, to join the NDX/NAZ, and potentially enter a downtrend SPX 2416 and 2406. Until one or the other occurs this mixed market continues. Short term support is at the 2428 and 2411 pivots, with resistance at the 2444 and 2456 pivots. Short term momentum ended the week nearing overbought. Trade what’s in front of you!
FOREIGN MARKETS
Asian markets were nearly all lower on the week losing 0.4%.
European markets were also nearly all lower losing 0.5%.
The DJ World index gained 0.2%, and the NYSE lost 0.2%.
COMMODITIES
Bonds continue to uptrend and gained 0.4% on the week. It looks like the 6-month decline in 10YR rates may be coming to an end soon. Long-term rates have been declining while the FED has been raising short term rates 75 bps, (Dec., Mar., and Jun). With the economy weakening some, and inflation rolling over, the likelihood of another rate increase is at best 6 months away.
Crude remains in a downtrend and lost 1.9% on the week. Time for the Saudi’s and Russia to talk it up again.
Gold is in an uptrend but lost 1.2% on the week. If stocks enter a downtrend Gold could catch a bid.
The USD remains in a downtrend but gained 0.1% on the week. The USD has also been in a decline since December. Since the FED started raising rates in December: USD down, Crude down and Bonds up.
NEXT WEEK
Light schedule for economic reports this week. Wednesday: existing home sales. Thursday: jobless claims and leading indicators. Friday: new home sales. Best to your week!
CHARTS: http://stockcharts.com/public/1269446/tenpp
After about 40 years of investing in the markets one learns that the markets are constantly changing, not only in price, but in what drives the markets. In the 1960s, the Nifty Fifty were the leaders of the stock market. In the 1970s, stock selection using Technical Analysis was important, as the market stayed with a trading range for the entire decade. In the 1980s, the market finally broke out of it doldrums, as the DOW broke through 1100 in 1982, and launched the greatest bull market on record.
Sharing is an important aspect of a life. Over 100 people have joined our group, from all walks of life, covering twenty three countries across the globe. It's been the most fun I have ever had in the market. Sharing uncommon knowledge, with investors. In hope of aiding them in finding their financial independence.
Copyright © 2017 Tony Caldaro - All Rights Reserved Disclaimer: The above is a matter of opinion provided for general information purposes only and is not intended as investment advice. Information and analysis above are derived from sources and utilising methods believed to be reliable, but we cannot accept responsibility for any losses you may incur as a result of this analysis. Individuals should consult with their personal financial advisors.
Tony Caldaro Archive |
© 2005-2022 http://www.MarketOracle.co.uk - The Market Oracle is a FREE Daily Financial Markets Analysis & Forecasting online publication.