


US Stock Market Update as the Trump Inauguration Approaches
Stock-Markets / Stock Market 2017 Jan 17, 2017 - 11:18 AM GMTBy: The_Gold_Report

 Technical analyst Clive Maund forecasts a stock market "swoon" in light of the impending inauguration of Donald Trump.
The election of Donald Trump sparked a rally in the broad stock market, which has continued up to the present. According to the laws of reverse (inverse) logic that rule the markets, his inauguration as President is likely to trigger a swoon, and as we will shortly see, there are other compelling technical reasons for the market to drop back soon. It is worth noting that selling might start kicking in before the inauguration.
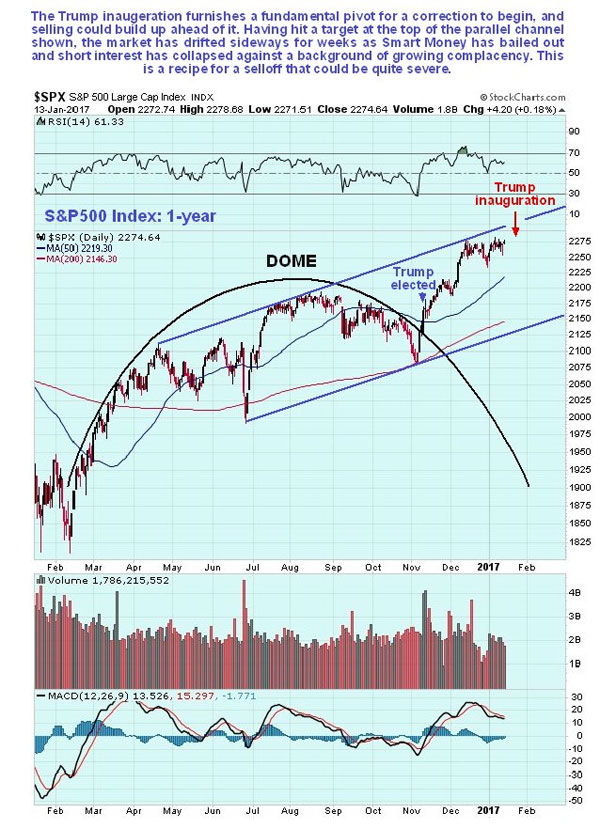
On the 1-year chart for the S&P500 index we can see that the breakout from the fine Dome pattern that developed during most of last year was caused by the election of Trump. Therefore, since the ensuing rally looks like the product of inflated and possibly unrealistic hopes regarding what Trump will go on to achieve, there is plenty of scope for disappointment, which psychologically is probably going to set in anyway once hopes of him becoming President become reality.
Since many regard him as crass and a buffoon, a reputation he has done little to diminish in recent days, you may wonder why he was granted the nomination for leader of the Republican party before the election, and why Bernie Sanders was "sold down the river." The reason appears to be that the Establishment wanted their stooge Hillary elected, and they calculated that if they presented an alternative who was so outlandish and "beyond the pale" as to be unelectable, Hillary would win. Unfortunately for them their little plan backfired, in large part because Trump's unguarded remarks and statements were a breath of fresh air after years of politicians not saying what they were thinking and trying to be politically correct all the time.
Returning to the chart, we see that the S&P500 kept on rising until it reached resistance at the top of the parallel channel shown that dates back to last spring, after which it has run off sideways in a narrow range, with downside risk growing.
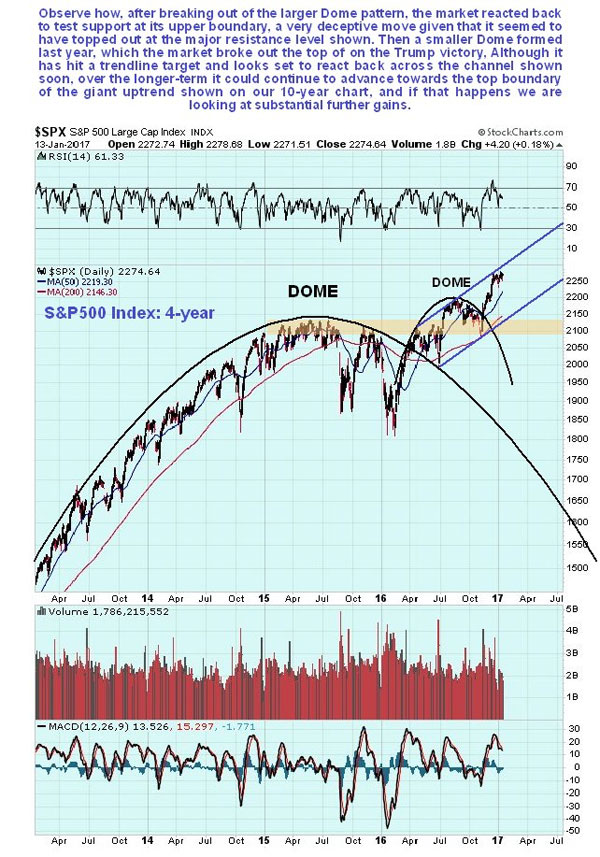
The 4-year chart provides broader perspective. On this chart we can see that we are a long way from being in a bear market. Since the market has recently made new highs, moving averages are in bullish alignment and there is no overhanging supply. Last year's Dome pattern followed a much larger one, so that they look like two Russian dolls. The market would have to break down from the parallel channel shown before we can even start to think about the possibly of a bear market setting in.
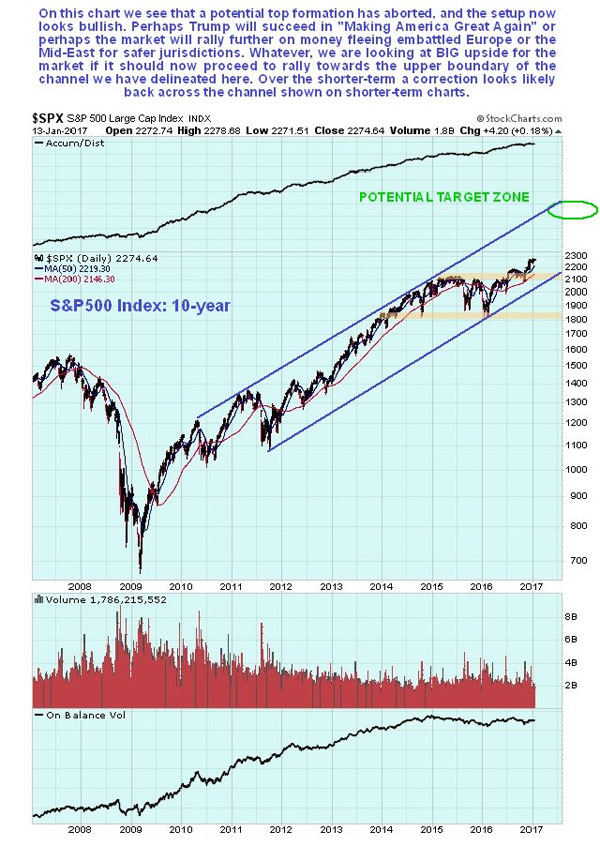
The long-term 10-year chart actually looks bullish, as the market has advanced to clear new highs following the abort of a large potential top area, and appears to be in position to advance toward the upper boundary of the giant parallel channel shown, which would result in big gains from its current level, even though other factors are pointing to a drop over the short to medium term. A breakdown from this large channel would be a serious negative development, so we should on the lookout for this.
Various indicators are pointing to a market swoon over the short to medium term, with the Trump inauguration being the obvious catalyst, and it could start ahead of the inauguration. We will now look at them.
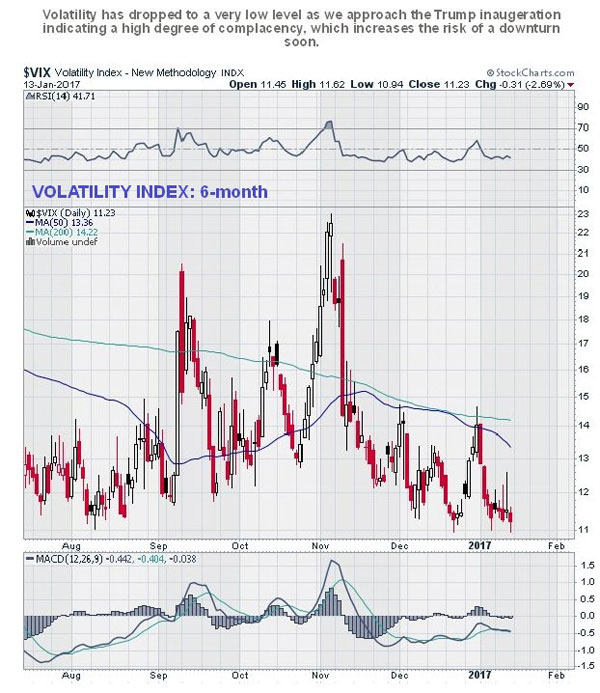
First is the Volatility Index or VIX, which is at a very low level, near to the levels seen in 2007 before the bear market started, meaning that market participants are feeling very laid back and complacent. Virtually no one expects the market to drop back much, which makes it that much more likely that it will.
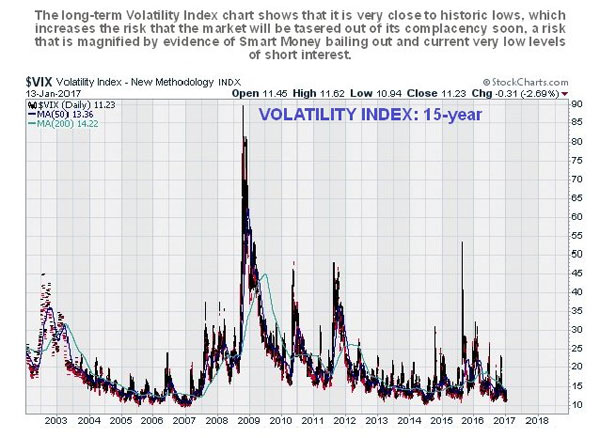
You can see how low VIX is historically on its 15-year chart. . .
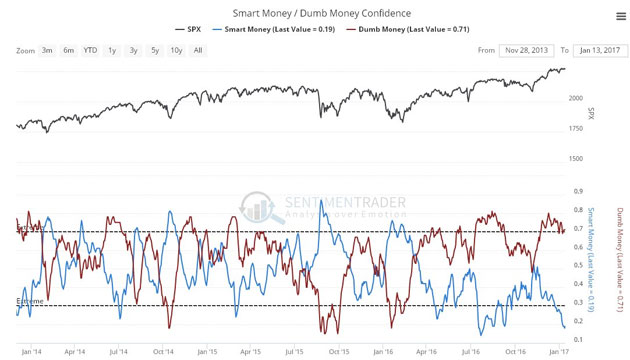
Next, the Smart / Dumb confidence index on which we see that Smart Money has made its way to the exits in recent weeks. This normally happens as a market continues higher, but on this occasion, it has happened as the market has moved sideways over the past month, which is rather unusual but certainly not positive. While it is hard to use this indicator in isolation for timing purposes, taken together with the other factors we are reviewing here, the case for a reversal soon looks quite solid.
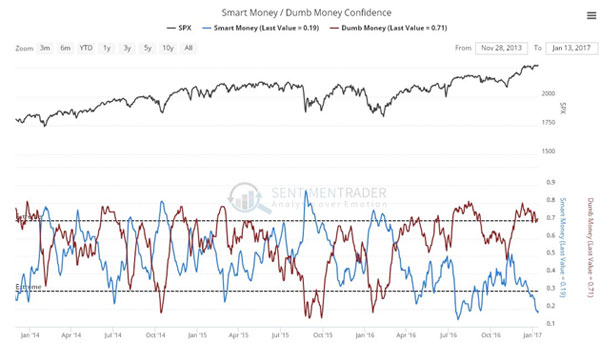
Chart courtesy of sentimentrader.com
Finally, we see that short interest has plunged in the recent past, a sign that bears are "throwing in the towel." This is bearish because a shrunken short interest means that there is little short-covering fuel to power a rally.
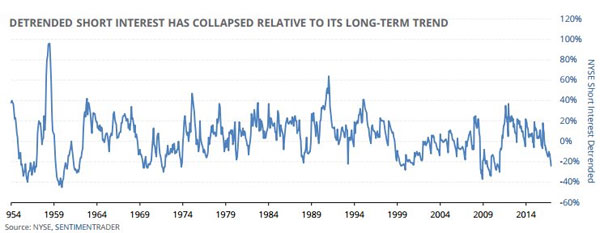
Chart courtesy of sentimentrader.com
So, as we approach the inauguration of Trump, let's sum up the important factors we have observed here that point to a significant market drop soon. They are:
1. The market arriving at a trendline target early in December and then running off sideways in a narrow range
2. The VIX at a very low level showing extreme complacency
3. Smart Money confidence sinking to a very low level—they have booked a lot of profits over the past month or so
4. And finally, short interest shrinking to a very low level, showing that they have at last been beaten into submission, which usually happens at the worst possible time (for them).
Clive Maund has been president of www.clivemaund.com, a successful resource sector website, since its inception in 2003. He has 30 years' experience in technical analysis and has worked for banks, commodity brokers and stockbrokers in the City of London. He holds a Diploma in Technical Analysis from the UK Society of Technical Analysts.
Want to read more Gold Report articles like this? Sign up for our free e-newsletter, and you'll learn when new articles have been published. To see recent articles with industry analysts and commentators, visit our Streetwise Interviews page.
Disclosure:
1) Statements and opinions expressed are the opinions of Clive Maund and not of Streetwise Reports or its officers. Clive Maund is wholly responsible for the validity of the statements. Streetwise Reports was not involved in the content preparation. Clive Maund was not paid by Streetwise Reports LLC for this article. Streetwise Reports was not paid by the author to publish or syndicate this article.
2) This article does not constitute investment advice. Each reader is encouraged to consult with his or her individual financial professional and any action a reader takes as a result of information presented here is his or her own responsibility. By opening this page, each reader accepts and agrees to Streetwise Reports' terms of use and full legal disclaimer. This article is not a solicitation for investment. Streetwise Reports does not render general or specific investment advice and the information on Streetwise Reports should not be considered a recommendation to buy or sell any security. Streetwise Reports does not endorse or recommend the business, products, services or securities of any company mentioned on Streetwise Reports.
Charts courtesy of Clive Maund
© 2005-2022 http://www.MarketOracle.co.uk - The Market Oracle is a FREE Daily Financial Markets Analysis & Forecasting online publication.