


Precious Metals Stocks May Be Poised for a Major Upswing
Commodities / Gold and Silver Stocks 2016 Nov 01, 2016 - 07:36 PM GMTBy: Clive_Maund

 Technical analyst Clive Maund outlines why he believes the correction in gold and precious metals stocks is coming to an end.
It now looks like gold's correction is done and its intermediate base pattern is completing. If so, then we are at an excellent entry point for many better precious metals (PM) stocks, which have been savagely beaten down over the past several months—a necessary correction following their outsized run-up earlier in the year.
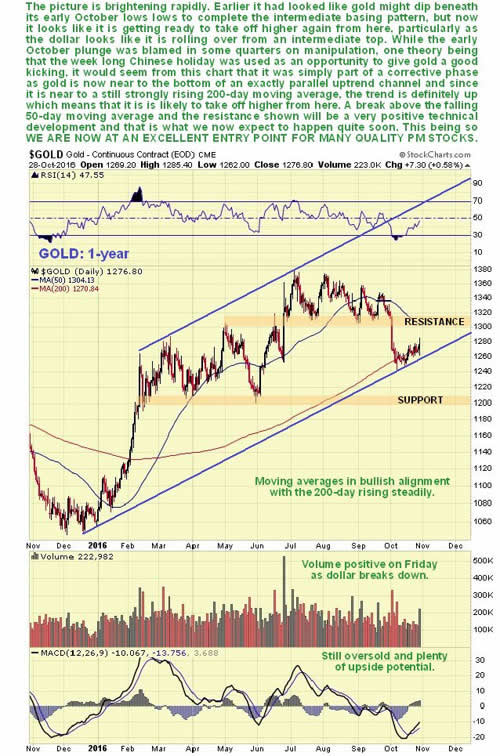
On its one-year chart, we can see that gold's corrective action from early July has brought it all the way back to its steadily rising 200-day moving average, a classic buy spot, where a potential intermediate base has formed. This corrective action has more than completely unwound the earlier overbought condition, and it may well be that the price is bottoming at the lower boundary of the large parallel uptrend channel shown, which is what various factors suggest.
These factors are behind the major uptrend still in force, as symbolized by the rising 200-day moving average already alluded to: the bullish alignment of moving averages, the price being at the lower boundary of the prospective channel shown, the earlier overbought condition having unwound and, finally, the dollar looking like it is breaking down from its uptrend of the past month, which we will look at later.
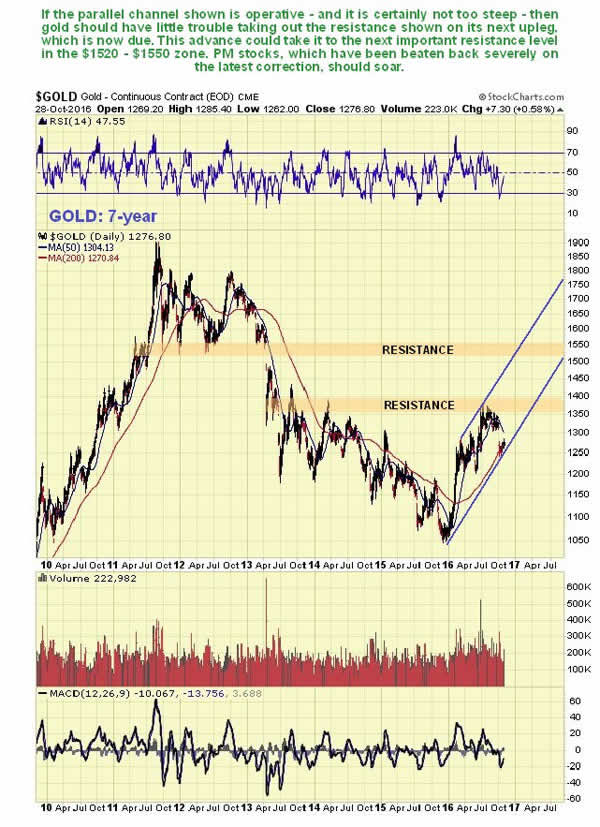
The seven-year chart for gold shows its new bull market in the context of the preceding bear market from the 2011 highs. This new bull market ran into trouble at the first resistance level shown, but after the recent correction it should now gather itself to take out this resistance on the next upleg, and target the next resistance level in the $1,520–1,550 zone. Needless to say, an advance to this objective will result in PM stocks, which have been severely beaten back on the correction, soaring to much higher levels. If this interpretation is correct, then we are at an excellent entry point for many PM stocks RIGHT NOW.
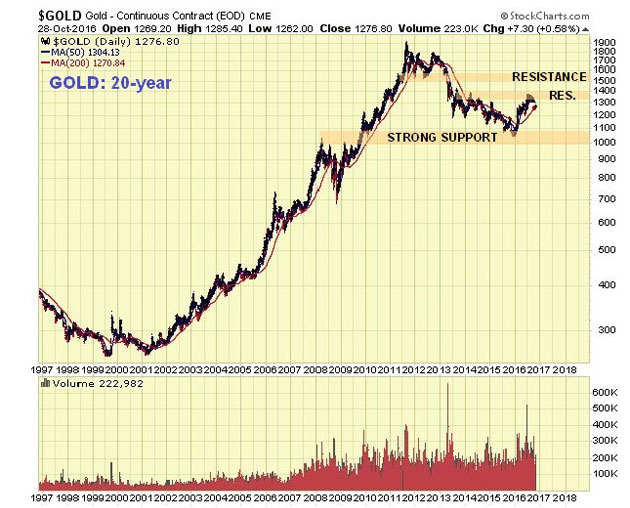
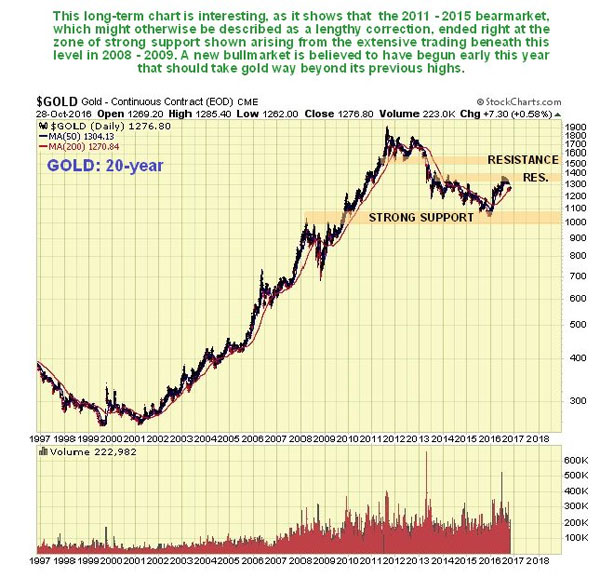
The 20-year gold chart is interesting, as it makes plain that the 2011–2015 bear market is really nothing more than a correction to the giant bull market from 2001 that preceded it. It also shows that this giant correction ended right at the zone of strong support shown just above the zone of extensive trading that occurred in 2008–2009, a very good point for it to reverse to the upside. The new bull market that is believed to have begun early this year should take gold way above its previous highs in the $1,900 area.
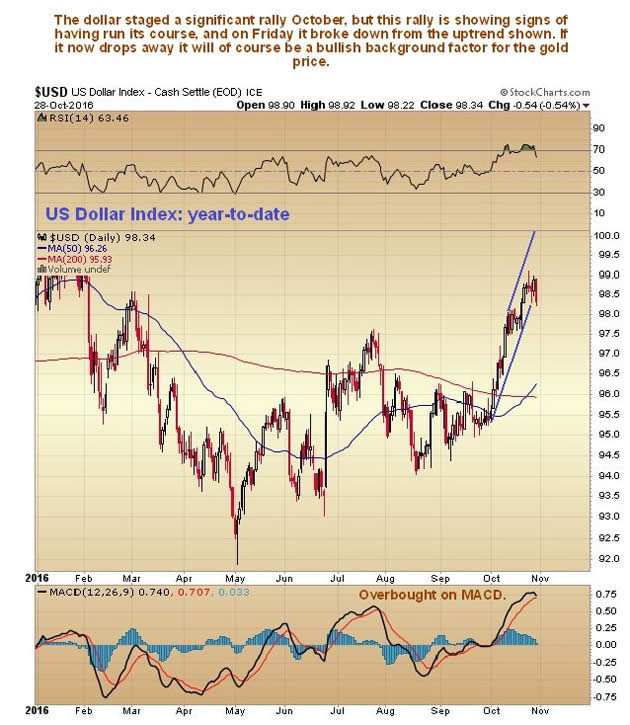
Another possible bullish factor for gold here is that the dollar appears to be breaking down from its uptrend that started at the beginning of the month, with an increasing risk that it will drop back across its range. We can see this to advantage on the year-to-date chart for the dollar index.
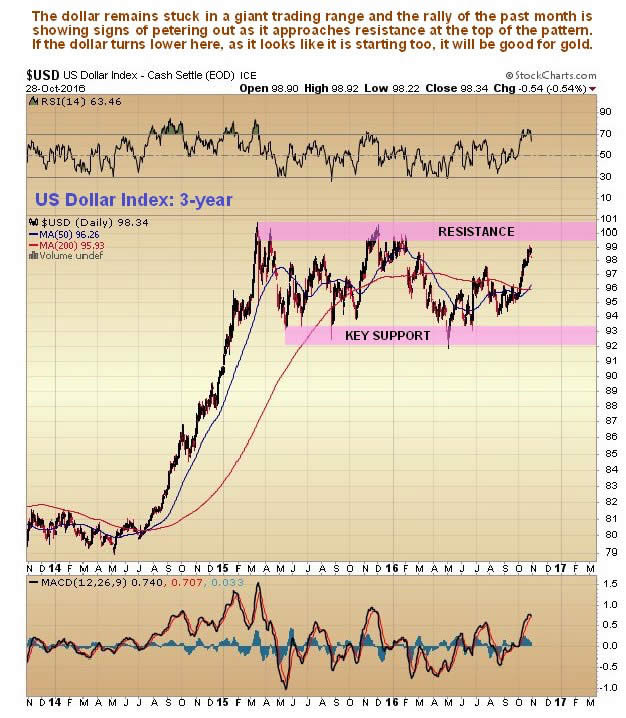
The three-year chart for the dollar index shows that it's still no change for the dollar, as it remains stuck in the giant trading range that started to form back at the March 2015 peak. Right now, having approached the resistance again at the top of the range, it looks like it is rolling over to drop back across the range again, which will be good news for gold.
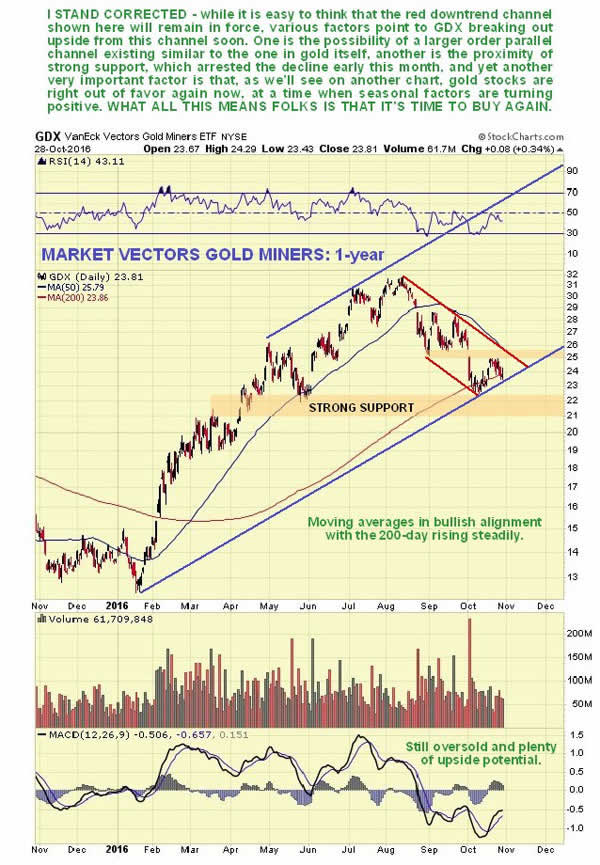
The one-year chart for GDX is most interesting. Many would-be PM-sector stock buyers are currently deterred from doing so by seeing that the red downtrend shown on our chart is still in force. However, it is very possible that this index is close to the lower boundary of the larger order uptrend channel shown—which is, of course, closely related to the parallel channel that we have observed on the one-year gold chart.
If so, then we are clearly at a very good point to buy, as the index will go on to break out upside from the red channel. Various factors strongly suggest that this is what is going to happen. In the first place, the index is close to a zone of strong underlying support, which arrested the decline early this month. Second, the 200-day moving average is still rising strongly, which shows that the major trend is still up. The moving averages are definitely in bullish alignment, with any rally now turning the 50-day up above the 200-day. Third, stocks are still oversold, after correcting back from being heavily overbought early in July.
Last but not least, most would-be investors in the sector are cringing timidly in the shadows as they usually are after a sharp drop. It's their right to buy high, and nobody and nothing is going to stop them. This is made abundantly plain by the Gold Miners Bullish Percent Index chart, which we will look at next.
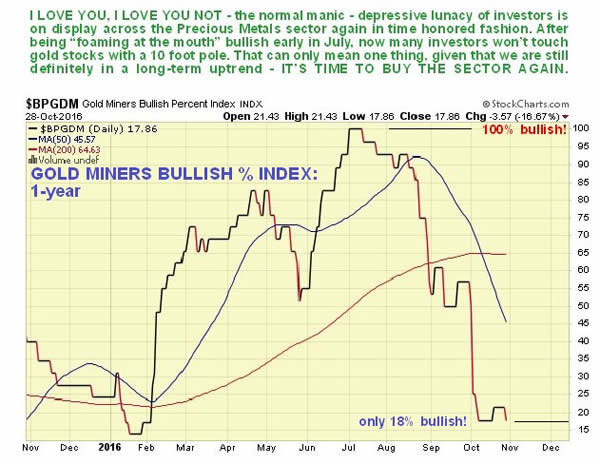
Finally, for those of you who are still feeling leery of buying gold stocks here, take a look at the latest Gold Miners Bullish Percent Index chart, which shows that sentiment has dropped from "foaming at the mouth," 100% bullish back in early July, when for many there was no sign of the impending sharp correction, to a paltry 18% bullish now. Ask yourself if you felt more bullish toward the sector back early in July than you do now, and you will have the answer to whether you should buy the sector now. Sure, it could drop more from here, but technically it's a lot less likely than it was back in July, and much more likely that a big rally starts soon.
Right now, gold and silver are thought to be powering up for another major upleg, hence these latest updates.
Clive Maund has been president of www.clivemaund.com, a successful resource sector website, since its inception in 2003. He has 30 years' experience in technical analysis and has worked for banks, commodity brokers and stockbrokers in the City of London. He holds a Diploma in Technical Analysis from the UK Society of Technical Analysts.
Want to read more Gold Report articles like this? Sign up for our free e-newsletter, and you'll learn when new articles have been published. To see recent articles with industry analysts and commentators, visit our Streetwise Interviews page.
Disclosure:
1) Statements and opinions expressed are the opinions of Clive Maund and not of Streetwise Reports or its officers. Clive Maund is wholly responsible for the validity of the statements. Streetwise Reports was not involved in the content preparation. Clive Maund was not paid by Streetwise Reports LLC for this article. Streetwise Reports was not paid by the author to publish or syndicate this article.
2) This article does not constitute investment advice. Each reader is encouraged to consult with his or her individual financial professional and any action a reader takes as a result of information presented here is his or her own responsibility. By opening this page, each reader accepts and agrees to Streetwise Reports' terms of use and full legal disclaimer. This article is not a solicitation for investment. Streetwise Reports does not render general or specific investment advice and the information on Streetwise Reports should not be considered a recommendation to buy or sell any security. Streetwise Reports does not endorse or recommend the business, products, services or securities of any company mentioned on Streetwise Reports.
Charts provided by Clive Maund
© 2005-2022 http://www.MarketOracle.co.uk - The Market Oracle is a FREE Daily Financial Markets Analysis & Forecasting online publication.