


Stocks Will Fall Anywhere From 17%-50% Depending on the Fed’s Response
Stock-Markets / Financial Crash Dec 14, 2015 - 06:07 PM GMTBy: Graham_Summers

 A major long-term momentum indicator is flashing, “sell.”
Based on the historical significance of this indicator we may be putting in a top and possibly THE top for the bull market that began 2009.
The indicator concerns the monthly moving average convergence divergence or MACD.
For those of you who like technical analysis, this indicator is formed by two interweaving lines.
The first line (usually black on the chart) is formed by subtracting the 26-month exponential moving average (EMA) from the 12-month EMA.
So if the 26-month EMA is 12 and 12-month EMA is 10, the black line would be at 2 for that particular day.
The second line (usually red on the chart) is formed by the 9-month exponential moving average.
The “signals” come when the two lines connect:
- Anytime the black line breaks above the red line, it triggers a “buy” signal.
- Anytime the black line breaks below the red line, it triggers a “sell” signal.
“Sell” signals usually coincide with market tops forming. They also trigger when bull markets END.
I’ve labeled the “sell” signals on the monthly chart of the S&P 500 below. We are using the monthly chart because we’re most concerned with timing when a multi-year bull market ends, NOT intermediate swings in price.
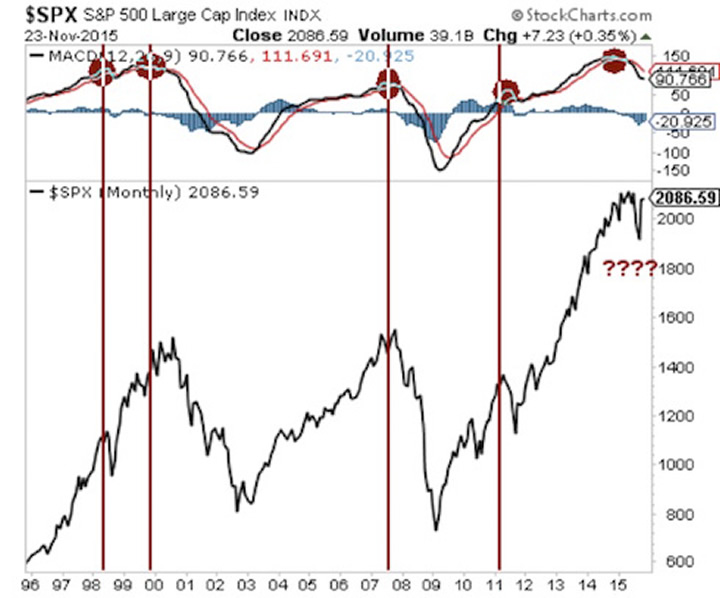
As you can see, this signal has been fairly accurate for picking tops.
Of course it’s more of an art than a science when it comes to timing the end of a bull market (two of the “sell” signals hit on short-term tops in 1998 and 2011, as opposed to the ultimate market tops which came later).
However, it is worth noting that even during those periods in which “sell” signals only coincided with temporary tops (1998 and 2011), BOTH times stocks staged a dramatic collapse before beginning their next leg up.
In 1998, when the “sell” signal triggered, stocks dropped nearly 20%.
In 2011, when the “sell” signal triggered, stocks fell 17% and the Fed announced Operation Twist to try and prop the markets up.
Moreover, the other times that this indicator registered a “sell signal” (the times when it coincided with THE top for stocks) the markets fell 50% and 57% respectively.
So the fact a “sell” signal is hitting now is of massive importance. It tells us that momentum is falling and we can expect a sizable correction in stocks at the very least and a Crash at the very worst.
Smart investors are preparing now.
Private Wealth Advisory subscribers are already profiting from the markets, having just closed THREE more winners yesterday, bringing us to a FORTY THREE trade winning streak…
What is Private Wealth Advisory?
Private Wealth Advisory is a WEEKLY investment newsletter that can help you profit from the markets. Every week you get pages of high quality editorial presenting market conditions and outlining the best trades to make to profit from them.
It is the only newsletter to have closed 72 consecutive winning trades in a 12 month period (ZERO losers during that time). And we just began another winning streak last year, already racking up 43 straight winners.
And we’ve only closed ONE loser in the last FOURTEEN MONTHS.
You can try Private Wealth Advisory for 30 days (1 month) for just $0.98 cents.
However, this offer will be expiring tomorrow at midnight. I cannot maintain a track record of over a YEAR of straight winners with thousands and thousands of investors following these recommendations.
To take out a $0.98 30-day trial subscription to Private Wealth Advisory… and lock in one of the few remaining slots….
Best Regards
Graham Summers
Phoenix Capital Research
http://www.phoenixcapitalmarketing.com
Graham also writes Private Wealth Advisory, a monthly investment advisory focusing on the most lucrative investment opportunities the financial markets have to offer. Graham understands the big picture from both a macro-economic and capital in/outflow perspective. He translates his understanding into finding trends and undervalued investment opportunities months before the markets catch on: the Private Wealth Advisory portfolio has outperformed the S&P 500 three of the last five years, including a 7% return in 2008 vs. a 37% loss for the S&P 500.
Previously, Graham worked as a Senior Financial Analyst covering global markets for several investment firms in the Mid-Atlantic region. He’s lived and performed research in Europe, Asia, the Middle East, and the United States.
© 2015 Copyright Graham Summers - All Rights Reserved Disclaimer: The above is a matter of opinion provided for general information purposes only and is not intended as investment advice. Information and analysis above are derived from sources and utilising methods believed to be reliable, but we cannot accept responsibility for any losses you may incur as a result of this analysis. Individuals should consult with their personal financial advisors.
Graham Summers Archive |
© 2005-2022 http://www.MarketOracle.co.uk - The Market Oracle is a FREE Daily Financial Markets Analysis & Forecasting online publication.