


Stock Market Primary V Wave Continues
Stock-Markets / Stock Markets 2015 Nov 21, 2015 - 01:56 PM GMTBy: Tony_Caldaro

 The market started the week at SPX 2023. After a big gap down Sunday night in index futures trading the market worked its way back up to open at SPX 2019 – the low for the week. After that the market rallied to SPX 2067 by Tuesday, then dipped to SPX 2046 also on Tuesday. Then after a gap up opening on Wednesday and Friday the market hit SPX 2097. Then dipped to end the week at SPX 2089. For the week the SPX/DOW gained 3.35%, the NDX/NAZ gained 3.85%, and the DJ World index gained 2.70%. Economic reports for the week were slightly positive. On the uptick: the CPI, building permits, the Philly FED, leading indicators, the WLEI, plus weekly jobless claims declined. On the downtick: industrial production, the NY FED, the NAHB, and housing starts. Next week’s reports will be highlighted by a FED governors meeting, Q3 GDP, the PCE and more Housing.
LONG TERM: bull market
The six year Cycle wave [1] bull market is currently in its fifth wave. Cycle wave [1] bull markets unfold in five primary waves. Primary waves I and II completed in 2011, and Primary waves III and IV completed this year. When Primary V concludes the bull market will end. Then a three wave, one to two year Cycle wave [2] bear market should follow.
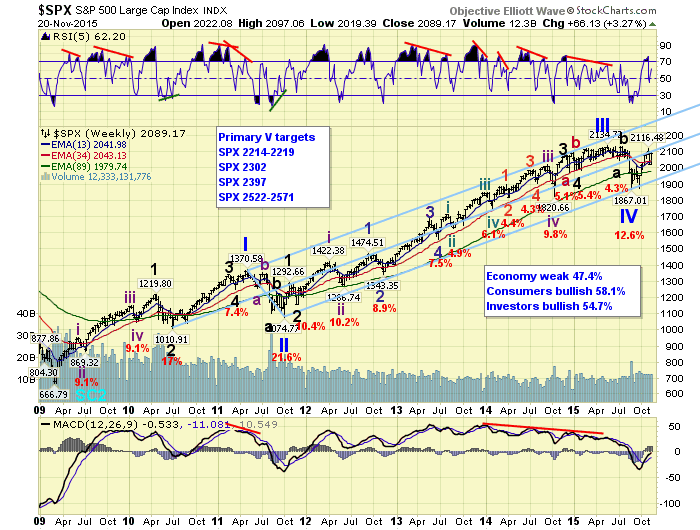
Historically markets have lost between 45% and 50% of their value during Cycle wave bear markets. In example, 1937-1942 and 1973-1974. The 2007-2009 bear market was of a Super cycle degree, one wave degree higher, and the market lost 58% of its value. These kinds of events are nothing unusual during a bearish secular deflationary/inflationary cycle. On a positive note. After the upcoming bear market ends, the following bear markets for the next three decades will be much smaller in market loss.
MEDIUM TERM: uptrend
We are currently labeling the current uptrend, from the late-August SPX 1867 low, as all of Primary wave V. Over the past three decades, when the first uptrend, after a significant fourth wave, made new bull market highs, 83% of the time it was the last uptrend. While the market has yet to make all time new highs during this uptrend. We are taking the conservative approach with the expectation that this will occur. Project, monitor and adjust when necessary. Should the market fail to make new highs during this uptrend, Primary V should extend well into at least 2016.
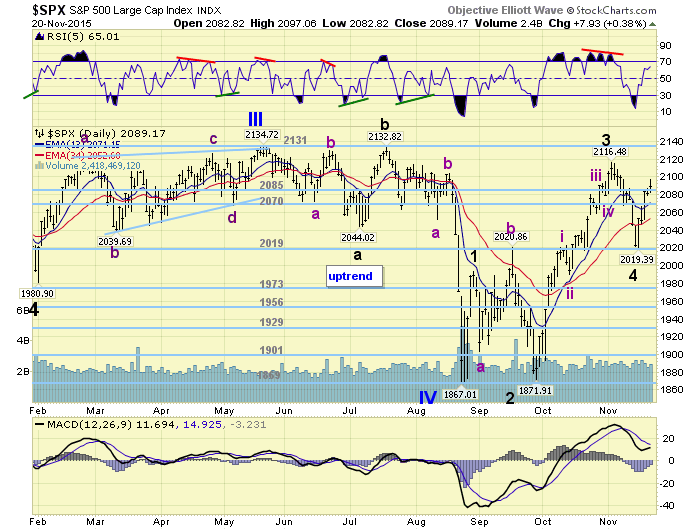
With all these factors in mind we have been labeling this uptrend as follows: Major 1 (1993), Major 2 (1872), Major 3 (2116), Major 4 (2019) and Major 5 underway. Major wave 1 was quite swift and divided into five Intermediate waves: 1915-1880-1990-1948-1993. Major wave 3, however, took more than one month to unfold as it subdivided quite a bit. Major wave 5 only started on Monday, at SPX 2019, and has currently divided into just three waves: 2067-2046-2097. Thus far it does not look as quick as Major 1, but its waves are unfolding in a similar fashion. Remaining conservative we have labeled Major 5 as: Int. i (2067), Int. ii (2046), and Int. iii currently underway. Whether or not, Int. iii subdivides into notable Minor waves has yet to be seen. Nonetheless, we are expecting Int. iii to make all time new highs before it concludes. Medium term support is at the 2085 and 2070 pivots, with resistance at the 2131 and 2145 pivots.
SHORT TERM
Now that this uptrend has completed four waves, and is in the fifth. We are able to make some additional calculations for a potential uptrend high, and bull market high. The previous OEW pivots, and potential upside targets, posted on the weekly chart still apply. We have uncovered, however, two additional pivots between the SPX 2131 and SPX 2198 pivots. These pivots are SPX 2145 and SPX 2170. You may have noticed this new pivot noted above.
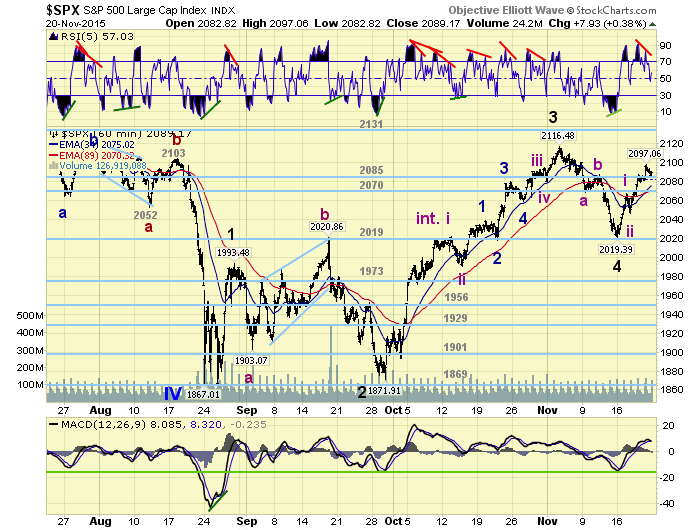
Thus far we have only noted three important waves during the recent rally from SPX 2019: 2067-2046-2097. The first two we have labeled Int. waves i and ii. The third, from that SPX 2046 low, is Int. wave iii. It could divide into five Minor waves. Thus far, we have not noticed a division. But if it does they will be labeled Minor waves. Overall we are expecting Int. iii to make marginal new highs before it concludes. Then an Int. wave iv pullback, of 20+ points, should be followed with another new high for Int. wave v. That second new high could end the bull market. If you have not started thinking of a bull market exit plan, it is probably time you did. Short term support is at the 2085 and 2070 pivots, with resistance at SPX 2116 and the 2131 pivots. Short term momentum ended the week at neutral.
FOREIGN MARKETS
Asian markets were mostly higher on the week and gained 1.6%.
European markets were all higher and gained 2.5%.
The Commodity equity group were all higher and gained 5.1%.
The DJ World index continues to uptrend and gained 2.7%
COMMODITIES
Bonds remain in a downtrend but gained 0.1% on the week.
Crude is also in a downtrend but gained 1.8% on the week.
Gold remains in a downtrend too and lost 0.6% on the week.
The USD remains in an uptrend and gained 0.5% on the week.
NEXT WEEK
Monday: Existing homes sales at 10am, and a FED governors meeting at 11:30. Tuesday: Q3 GDP, Case-Shiller and Consumer confidence. Wednesday: weekly Jobless claims, Personal income/spending, the PCE, Durable goods, the FHFA, Consumer sentiment and New home sales. Thursday: Thanksgiving holiday. Friday: markets close at 1pm. Best to your weekend, week and Holiday!
CHARTS: http://stockcharts.com/public/1269446/tenpp
After about 40 years of investing in the markets one learns that the markets are constantly changing, not only in price, but in what drives the markets. In the 1960s, the Nifty Fifty were the leaders of the stock market. In the 1970s, stock selection using Technical Analysis was important, as the market stayed with a trading range for the entire decade. In the 1980s, the market finally broke out of it doldrums, as the DOW broke through 1100 in 1982, and launched the greatest bull market on record.
Sharing is an important aspect of a life. Over 100 people have joined our group, from all walks of life, covering twenty three countries across the globe. It's been the most fun I have ever had in the market. Sharing uncommon knowledge, with investors. In hope of aiding them in finding their financial independence.
Copyright © 2015 Tony Caldaro - All Rights Reserved Disclaimer: The above is a matter of opinion provided for general information purposes only and is not intended as investment advice. Information and analysis above are derived from sources and utilising methods believed to be reliable, but we cannot accept responsibility for any losses you may incur as a result of this analysis. Individuals should consult with their personal financial advisors.
Tony Caldaro Archive |
© 2005-2022 http://www.MarketOracle.co.uk - The Market Oracle is a FREE Daily Financial Markets Analysis & Forecasting online publication.