


Gold Stocks Gearing Up For a Big Rally
Commodities / Gold & Silver Stocks Jun 30, 2008 - 08:48 AM GMTBy: Michael_Swanson

 While the broad market fell last week gold rallied hard. For the past few weeks we've seen gold and gold stocks held down as various US Federal Reserve officials have talked more hawkish about inflation and market analysts have predicted future rate hikes from the Fed later this year. As I wrote last week though I do not believe we'll see the Fed raise rates this year, because I'm expecting the bear market in stocks and further banking problems to force them to stay on hold. Once this becomes clear to the market - which I think will happen in the Fall - I'm expecting we'll see some real fireworks - with steep losses in stocks and the dollar - which will lead to an explosion in the price of gold.
It is noteworthy that while the market suffered losses on Thursday and Friday gold stocks rallied hard. This is proof that a drop in the broad US stock market doesn't necessarily translate into a drop in gold or mining stocks.
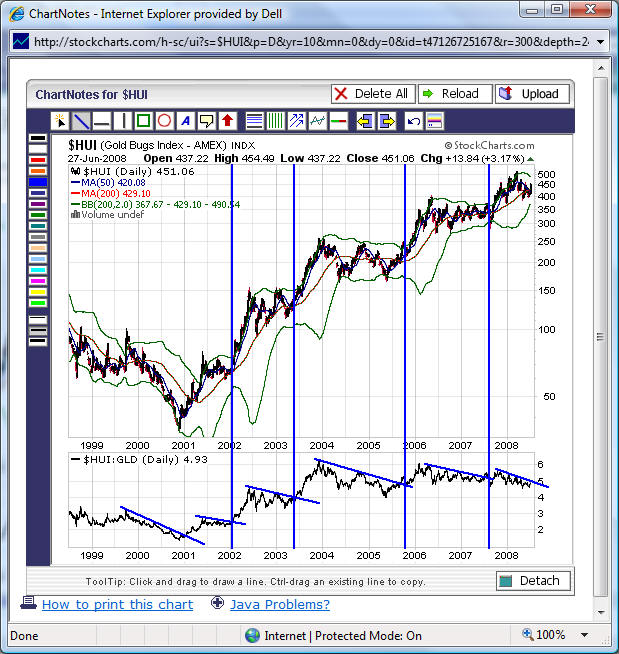
Let's step back for a few minutes and take a look at a ten year chart of gold stocks. There are two things I want you to notice. First large rallies in gold stocks have been preceded by the 200-day bollinger bands for the HUI and XAU gold stock indices coming together. Each of the last four times that this has happened in the past ten years gold stocks rallied hard for the next several months - and sometimes for a whole year. What causes the 200-day bollinger bands to come together are long periods of low volatility in gold stocks. They simply traded in a range for months and then broke out to the upside.
At the same time gold stocks have a tendency to lead the metal. As a result the XAU/gold and HUI/gold relative strength ratios have been important indicators to follow to determine the trend in gold stocks. During gold stocks corrections or long periods of consolidation these ratios have traded in downtrends. One can draw simple downtrend resistance lines on this ratio during such times. The start of large rallies in mining stocks have coincided with this ratio breaking above these relative strength downtrend resistance lines.
Gold stocks most recently put in a top that coincided with the last major low in the S&P 500. As the Fed bailed out Bear Stearns by giving billions of dollars to JP Morgan so that it could take over its worthless "Level 3" mortgage debt, gold stocks peaked. They then fell hard into May and have since gone sideways. The whole time from March to today should be seen as part of a 4-6 month long summer consolidation period. I still believe that gold stocks are still in a consolidation pattern, but are likely to break out of it by the end of August and begin a rally that will last into the end of the year. This projection matches the historical seasonal pattern of gold stocks consolidating in the summer and then having their best months from late August through March.
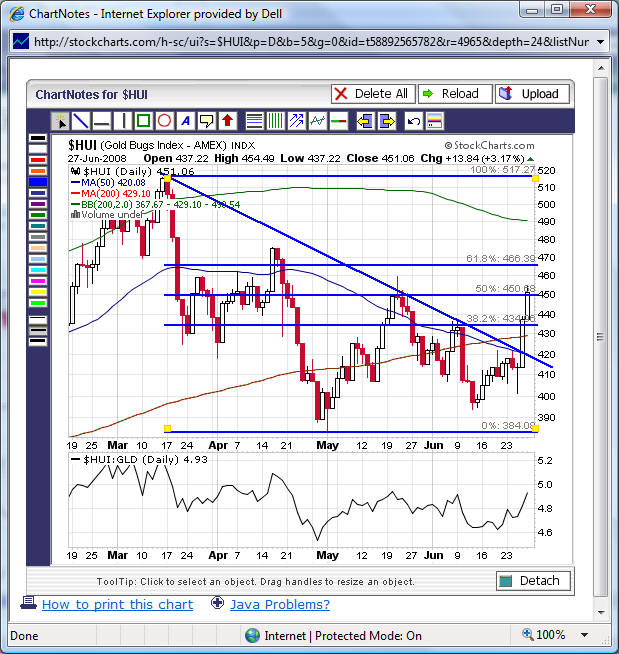
On Thursday the HUI broke above its downtrend line that connects its March, May, and June highs. The next resistance area for the HUI is in the 467-490 area. This is the area between its upper 200-day bollinger band and the 2/3's retracement level of the March high and May low. I personally have 470 as a target.
It is logical to expect some sort of pullback in this resistance zone to take place for gold stocks. They should then consolidate for several weeks and then breakout. If they do indeed breakout they will rally through their upper 200-day bollinger band and begin a rally that should last into the end of the year.
This setup would lead to about another 4-6 weeks of consolidation and cause the 200-day bollinger bands to narrow even further. We will have to see how things are situated in August, but the possibility of a truly bullish setup evolving is highly likely. I'll keep my eyes on this for you over the next few weeks.
This article is an excerpt from a WallStreetWindow subscription article. To receive my stock picks and all future articles just click here .
By Michael Swanson
WallStreetWindow.com
Mike Swanson is the founder and chief editor of WallStreetWindow. He began investing and trading in 1997 and achieved a return in excess of 800% from 1997 to 2001. In 2002 he won second place in the 2002 Robbins Trading Contest and ran a hedge fund from 2003 to 2006 that generated a return of over 78% for its investors during that time frame. In 2005 out of 3,621 hedge funds tracked by HedgeFund.Net only 35 other funds had a better return that year. Mike holds a Masters Degree in history from the University of Virginia and has a knowledge of the history and political economy of the United States and the world financial markets. Besides writing about financial matters he is also working on a history of the state of Virginia. To subscribe to his free stock market newsletter click here .
Copyright © 2008 Michael Swanson - All Rights Reserved.
Disclaimer -
WallStreetWindow.com is owned by Timingwallstreet, Inc of which Michael Swanson is President and sole shareholder. Both Swanson and employees and associates of Timingwallstreet, Inc. may have a position in securities which are mentioned on any of the websites or commentaries published by TimingWallStreet or any of its services and may sell or close such positions at any moment and without warning. Under no circumstances should the information received from TimingWallStreet represent a recommendation to buy, sell, or hold any security. TimingWallStreet contains the opinions of Swanson and and other financial writers and commentators. Neither Swanson, nor TimingWallstreet, Inc. provide individual investment advice and will not advise you personally concerning the nature, potential, value, or of any particular stock or investment strategy. To the extent that any of the information contained on any TimingWallStreet publications may be deemed investment advice, such information is impersonal and not tailored to the investment needs of any specific person. Past results of TimingWallStreet, Michael Swanson or other financial authors are not necessarily indicative of future performance.
TimingWallStreet does not represent the accuracy nor does it warranty the accuracy, completeness or timeliness of the statements published on its web sites, its email alerts, podcats, or other media. The information provided should therefore be used as a basis for continued, independent research into a security referenced on TimingWallStreet so that the reader forms his or her own opinion regarding any investment in a security published on any TimingWallStreet of media outlets or services. The reader therefore agrees that he or she alone bears complete responsibility for their own investment research and decisions. We are not and do not represent ourselves to be a registered investment adviser or advisory firm or company. You should consult a qualified financial advisor or stock broker before making any investment decision and to help you evaluate any information you may receive from TimingWallstreet.
Consequently, the reader understands and agrees that by using any of TimingWallStreet services, either directly or indirectly, TimingWallStreet, Inc. shall not be liable to anyone for any loss, injury or damage resulting from the use of or information attained from TimingWallStreet.
Michael Swanson Archive |
© 2005-2022 http://www.MarketOracle.co.uk - The Market Oracle is a FREE Daily Financial Markets Analysis & Forecasting online publication.