US New Homes Taking Longer Sell
Housing-Market / US Housing Jun 26, 2008 - 11:50 AM GMTBy: Paul_L_Kasriel
 I hope the Census Bureau can count the number of people in the U.S. better than it can count the number of new homes sold. The first estimate of a given month's sales is notoriously off. So, we should take the first estimate of May sales and inventories of new homes with a grain of salt. Be that as it may, May new home sales retreated 2.5% to an annualized pace of 512 thousand units. The low sales rate for this cycle to date is 501 thousand established in March. The sales region that really put a dent in the total was the wild West, where sales declined 11.63% to a cycle low annual rate.
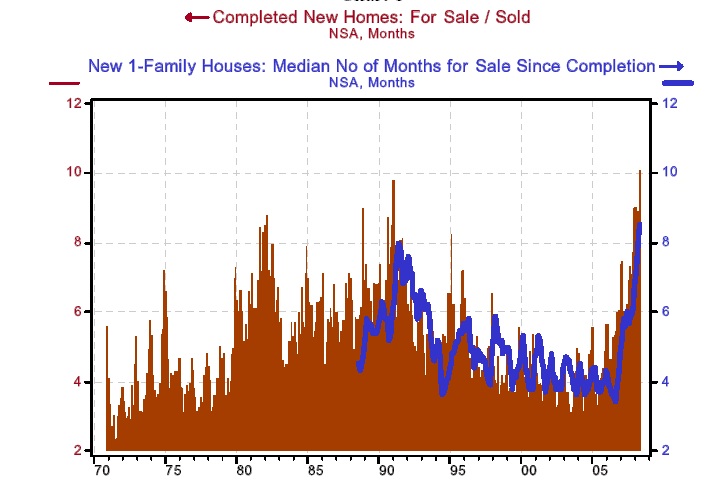
But I want to concentrate on the difficulty developers are having in moving their "merchandise" and what the supply looks like relative to demand. The chart shows that it took a record high 8.5 months for builders to sell a home after it was completed. Also chart 1 shows that the months' supply of completed homes at the May sales rate was a record 10.1. The bottom line is that that the bottom in the housing market and house prices is nowhere in sight.

By Paul L. Kasriel
The Northern Trust Company
Economic Research Department - Daily Global Commentary
Copyright © 2007 Paul Kasriel
Paul joined the economic research unit of The Northern Trust Company in 1986 as Vice President and Economist, being named Senior Vice President and Director of Economic Research in 2000. His economic and interest rate forecasts are used both internally and by clients. The accuracy of the Economic Research Department's forecasts has consistently been highly-ranked in the Blue Chip survey of about 50 forecasters over the years. To that point, Paul received the prestigious 2006 Lawrence R. Klein Award for having the most accurate economic forecast among the Blue Chip survey participants for the years 2002 through 2005.
The opinions expressed herein are those of the author and do not necessarily represent the views of The Northern Trust Company. The Northern Trust Company does not warrant the accuracy or completeness of information contained herein, such information is subject to change and is not intended to influence your investment decisions.
Paul L. Kasriel Archive |
The Nondefense Market for Durable Goods - The Big Picture
The Chart shows that in May, shipments of durable goods excluding defense were down year-over-year 4.4%; new orders for the same were down 4.3%. Both started to soften in late 2006 w
© 2005-2022 http://www.MarketOracle.co.uk - The Market Oracle is a FREE Daily Financial Markets Analysis & Forecasting online publication.


