


What Can We Infer From the Stocks-to-Oil Stocks Ratio?
Commodities / Oil Companies Jun 10, 2015 - 11:08 AM GMTBy: Nadia_Simmons

 The beginning of May brought a new 2015 high of $62.58 in crude oil, but we didn’t see a fresh high in case of oil stocks. In the following weeks, crude oil has been trading in a narrow range and erased less than 38.2% of earlier rally. What happened at the same time with the XOI? The index declined sharply and approached the 61.8% Fibonacci retracement in the recent days, showing its weakness in relation to light crude. Are there any factors on the horizon that could drive oil stocks higher or lower in the near future? Is it possible that the stocks-to-oil stocks ratio give us valuable clues about future moves?
Looking at the oil market from today’s point of view, we can say with full conviction that April was the best month for oil bulls since last June. Back then, oil stocks climbed to the 38.2% Fibonacci retracement, while crude oil erased almost 30% of the June-March declines. Although the XOI seemed to be stronger than the WTI, the beginning of May brought a new 2015 high of $62.58 in crude oil, but we didn’t see a fresh high in case of oil stocks. In the following weeks, crude oil has been trading in a narrow range and erased less than 38.2% of earlier rally. What happened at the same time with the XOI? The index declined sharply and approached the 61.8% Fibonacci retracement in the recent days, showing its weakness in relation to light crude.
Will the proximity to this important retracement encourage oil bulls to act? Or maybe we’ll see further deterioration? Before we try to answer these questions, we'll examine the NYSE Arca Oil Index (XOI) in different time horizons and find out if there's something else on the horizon that could drive oil stocks higher or lower in the near future. On top of that, we also decided to focus on the connection between the XOI and the general stock market to find out what impact the S&P500 index could have on the oil stock index’s future moves (charts courtesy by http://stockcharts.com).
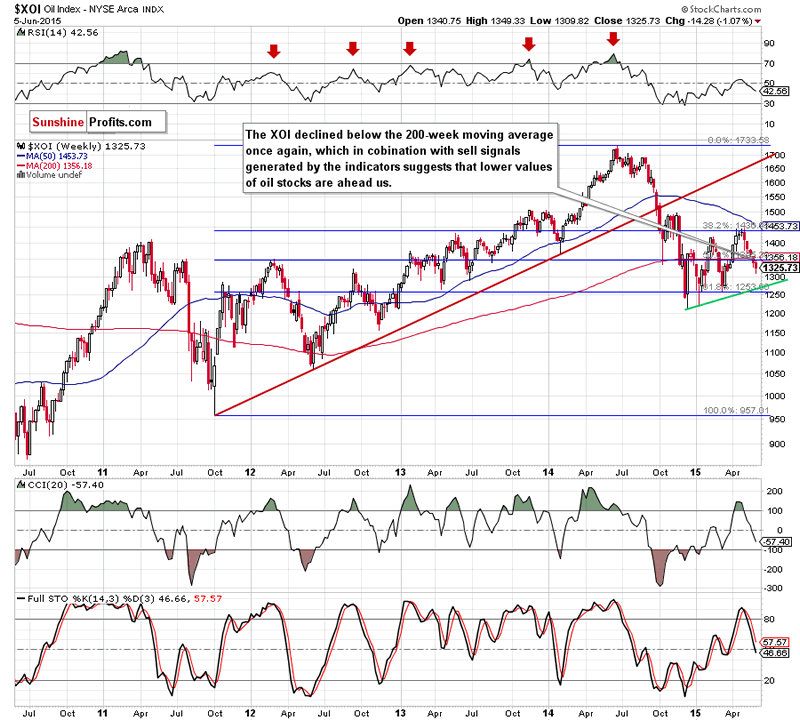
From today’s point of view we see that oil bears not only took the XOI to around 1,360, where the previously-broken medium-term declining red line was, but also managed to push the index lower. With this downward move, oil stocks declined below the 200-week moving average once again, which in combination with sell signals generated by the indicators suggests that further deterioration is still ahead us. If this is the case, and the XOI moves lower from here, the initial downside target would be around 1,270, where currently the green support line based on the Dec and Jan lows is.
Are there any short-term factors that could hinder the realization of the above scenario? Let’s examine the daily chart and find out.
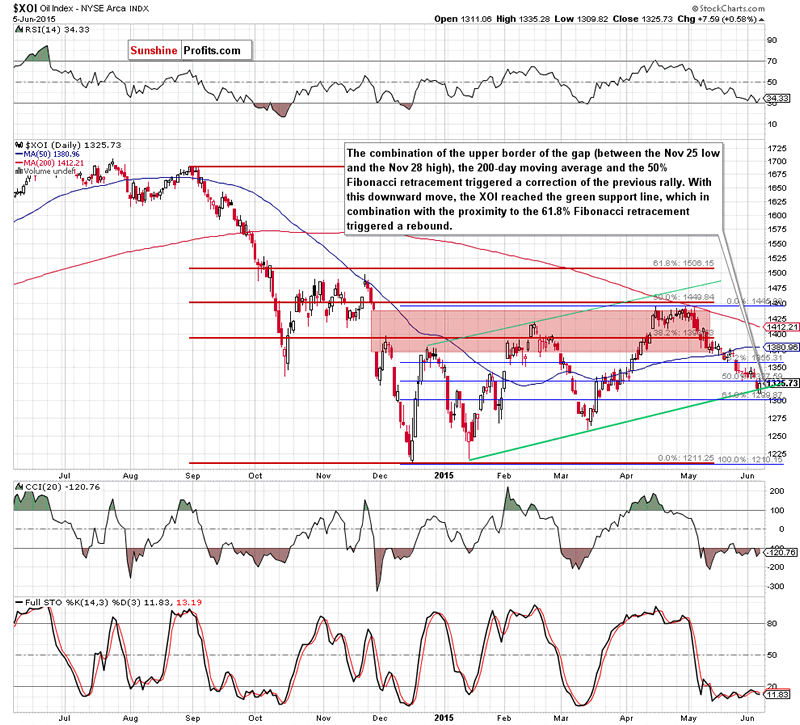
Looking at the daily chart, we see that the combination of the upper border of the gap (between the Nov 25 low and the Nov 28 high), the 200-day moving average and the 50% Fibonacci retracement level stopped further improvement, triggering a correction of the previous rally. With this downward move, the XOI reached the green support line (based on the Jan 14, and Mar13 lows), which in combination with the proximity to the 61.8% Fibonacci retracement (based on the entire Dec-Apr upward move) triggered a rebound.
At this point, it is also worth noting that the RSI bounced off the level of 30, generating a buy signal, while the CCI and Stochastic Oscillator are oversold and very close to do the same in the coming days. If we see such price action, the XOI will likely moves higher from here and climb to the 38.2% Fibonacci retracement based on the entire recent decline (around 1,360) in the coming days.
Before we summarize today’s article, let’s take a look at the relation between the general stock market an oil stocks. Will it confirm the above pro-growth scenario?
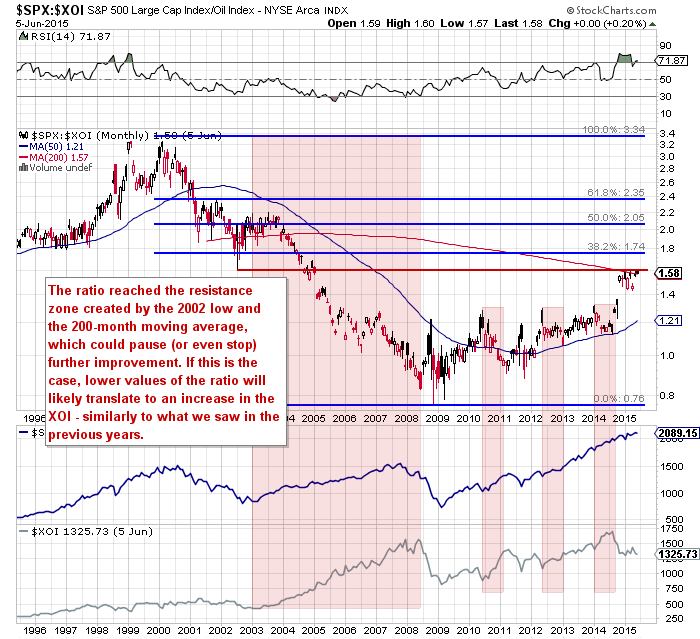
As you see on the above chart, the ratio reached the resistance zone created by the 2002 low and the 200-month moving average, which could pause (or even stop) further improvement. When we take a closer look at the chart, we notice that we saw such situation in the previous years and also in Jan and then in March (we marked these periods of time with red rectangles). In all these cases, lower values of the ratio translated to an increase in the XOI. Therefore, another pullback from here will likely trigger an improvement in oil stocks in the coming week(s).
Summing up, oil stocks extended losses and reached the green support line based on the Jan and Mar lows, which in combination with the proximity to the 61.8% Fibonacci retracement, the position of the daily indicators and the current situation in the SPX:XOI ratio suggests that we could see a rebound from here to around 1,360 in the coming week(s).
Please note that you can find other interesting ratios that give us valuable clues about crude oil’s, oil stocks’ and even gold’s future moves in our monthly Oil investment Updates. If you enjoyed the above analysis, we invite you to sign up for our free mailing list and stay up-to-date with our other free articles. It’s free and if you don’t like it, you can easily unsubscribe. Sign up today.
Thank you.
Nadia Simmons
Sunshine Profits‘ Contributing Author
Oil Investment Updates
Oil Trading Alerts
* * * * *
Disclaimer
All essays, research and information found above represent analyses and opinions of Nadia Simmons and Sunshine Profits' associates only. As such, it may prove wrong and be a subject to change without notice. Opinions and analyses were based on data available to authors of respective essays at the time of writing. Although the information provided above is based on careful research and sources that are believed to be accurate, Nadia Simmons and his associates do not guarantee the accuracy or thoroughness of the data or information reported. The opinions published above are neither an offer nor a recommendation to purchase or sell any securities. Nadia Simmons is not a Registered Securities Advisor. By reading Nadia Simmons’ reports you fully agree that he will not be held responsible or liable for any decisions you make regarding any information provided in these reports. Investing, trading and speculation in any financial markets may involve high risk of loss. Nadia Simmons, Sunshine Profits' employees and affiliates as well as members of their families may have a short or long position in any securities, including those mentioned in any of the reports or essays, and may make additional purchases and/or sales of those securities without notice.
© 2005-2022 http://www.MarketOracle.co.uk - The Market Oracle is a FREE Daily Financial Markets Analysis & Forecasting online publication.