


U.S. 30 Year Treasury Bonds – A Rally To Sell?
Interest-Rates / US Bonds Jul 01, 2013 - 06:53 PM GMTBy: Michael_Noonan

 Trading opportunities arise every day, however, quality trades that offer an edge do not.
We use developing market activity, as depicted in charts, to find trade potentials with a
defined limited risk and greater reward potential. 30 Year Bonds appear to be advertising
weakness and a shorting opportunity.
Trading opportunities arise every day, however, quality trades that offer an edge do not.
We use developing market activity, as depicted in charts, to find trade potentials with a
defined limited risk and greater reward potential. 30 Year Bonds appear to be advertising
weakness and a shorting opportunity.
When seeking trades, we use the “If, Then,” approach. IF the market does this, THEN we do that. The latter is acted upon only if the former requirements are met. Following this scenario, there is no guesswork or predicting involved, and the emotional element is not in play, either. Discipline is required, but it leads to more profitable trading potentials, so it is worth the effort.
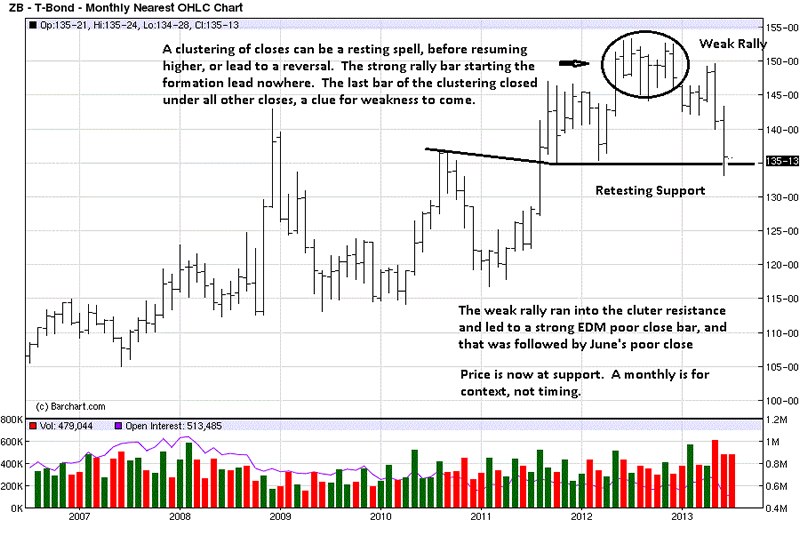
The first step is to put the market into a context, and that comes from assessing the higher, more controlling time frames. We start with the monthly..
The most important first step is to always identify the trend within the time frame under consideration. We look for synergy amongst all time frames to increase the odds of accomplishing a successful trade. From the clustering of closes top formation, a low was established in March, 4th bar from right, a lower swing high two bars later, in May, and another lower low, at the end of June. This is the simplest definition of a downtrend.
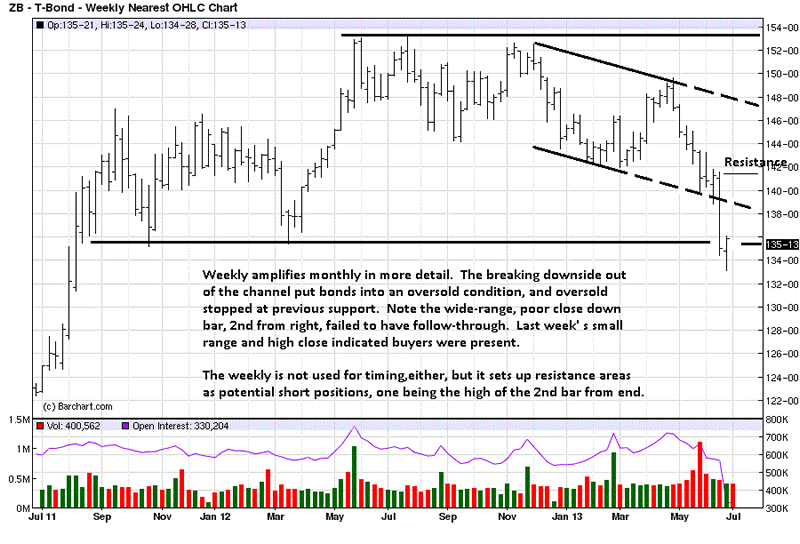
Chart comments explain the weakened structure for Bonds since the high. June, the last bar, retested support from 2011 and 2012 lows. The weekly is used to refine the bars.
The weekly shows more of a trading range, and the second to last week was a strong move down with a poor close, the market telling us sellers are in charge. But were they? Price declined into support, and leaving the channel put price into an oversold condition. As a consequence, there was no further downside follow-through, as the last weekly bar shows.
The last bar gives added confirmation that support is likely to hold, at least initially. Why? Note how small the range was and the position of the close. The smaller range tells us that buyers were present, not only preventing sellers from extending the market lower, but the high-end close lets us know buyers overwhelmed sellers’ efforts. That is important to know. If short, it would be a good reason to cover and stand aside. This is how to use the information from the market as the best and most reliable guide.
With the trend down, within a larger trading range, it becomes a personal choice of one’s trading skill[s] whether to trade from the long side at this support. We choose not to, and instead look for a weak rally to sell.
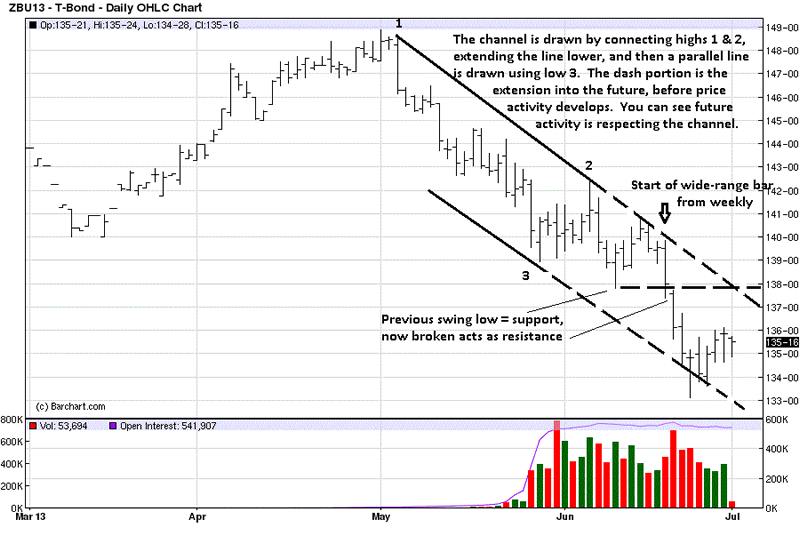
The last five bars on the daily comprise the last small bar from the weekly. While it looked like buyers were stopping sellers, it was more in the form of short-covering, after such a large drop in the weeks preceding. Short-covering is not the same as net new buying. In fact, the last five bars are relatively weak in an ability to rally higher, and that is what can be expected in a downtrend.
A rally against a wide-range down bar can meet resistance anywhere along the bar, from the low up to the high. The down arrow shows the high. However, bonds may run into resistance at where the mid-June swing low support was broken by that wide range bar. The dashed horizontal line from that swing low becomes future potential resistance.
What to look for, right now, is a weak rally. Small ranges up and less volume, relative to larger ranges down on stronger volume constitutes a weak rally, and they typically fail at an area of identified resistance.
If, then.
By Michael Noonan
Michael Noonan, mn@edgetraderplus.com, is a Chicago-based trader with over 30 years in the business. His sole approach to analysis is derived from developing market pattern behavior, found in the form of Price, Volume, and Time, and it is generated from the best source possible, the market itself.
© 2013 Copyright Michael Noonan - All Rights Reserved Disclaimer: The above is a matter of opinion provided for general information purposes only and is not intended as investment advice. Information and analysis above are derived from sources and utilising methods believed to be reliable, but we cannot accept responsibility for any losses you may incur as a result of this analysis. Individuals should consult with their personal financial advisors.
Michael Noonan Archive |
© 2005-2022 http://www.MarketOracle.co.uk - The Market Oracle is a FREE Daily Financial Markets Analysis & Forecasting online publication.