US Homebuilders Stocks Bullish Pattern Developing
Housing-Market / US Housing Jan 31, 2008 - 09:15 PM GMTBy: Mike_Paulenoff
 Let's have a look at the near term pattern development in the XHB (Homebuilders ETF), which is being led by components PHM, HOV, DRI, HD, KBH... all of which have very dynamic chart formation after an entire year (or more) of relentless weakness.
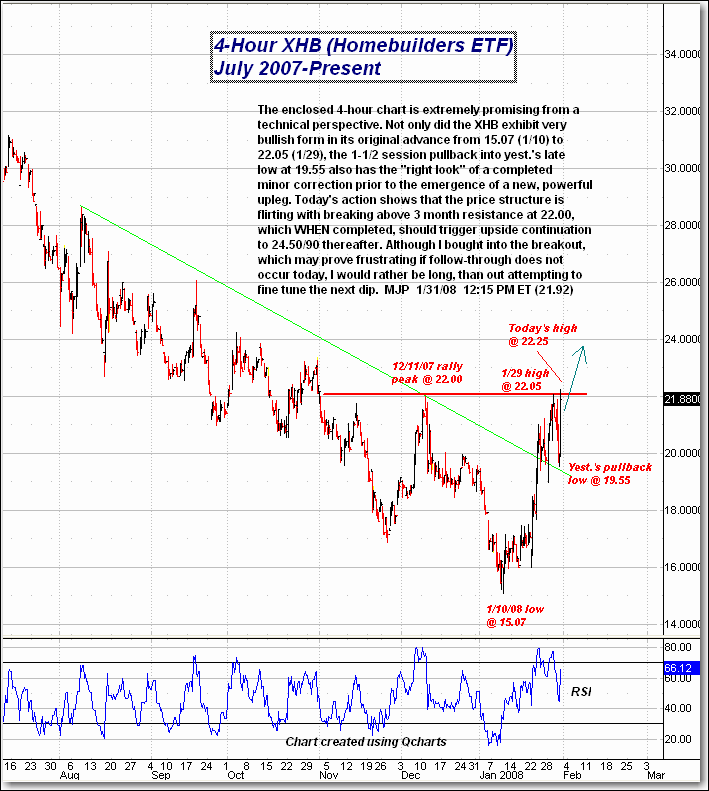
The enclosed 4-hour chart is extremely promising from a technical perspective. Not only did the XHB exhibit very bullish form in its original advance from 15.07 (1/10) to 22.05 (1/29), the 1 1/2-session pullback into yesterday's late low at 19.55 also has the "right look" of a completed minor correction prior to the emergence of a new, powerful upleg. Today's action shows that the price structure is flirting with breaking above 3-month resistance at 22.00, which when completed should trigger upside continuation to 24.50/90 thereafter. Although I bought into the breakout, which may prove frustrating if follow-through does not occur today, I would rather be long than out attempting to fine-tune the next dip.

Sign up for a free 15-day trial to Mike's ETF Trading Diary today.
By Mike Paulenoff
Mike Paulenoff is author of the MPTrader.com (www.mptrader.com) , a real-time diary of Mike Paulenoff's trading ideas and technical chart analysis of Exchange Traded Funds (ETFs) that track equity indices, metals, energy commodities, currencies, Treasuries, and other markets. It is for traders with a 3-30 day time horizon, who use the service for guidance on both specific trades as well as general market direction
© 2002-2008 MPTrader.com, an AdviceTrade publication. All rights reserved. Any publication, distribution, retransmission or reproduction of information or data contained on this Web site without written consent from MPTrader is prohibited. See our disclaimer.
Mike Paulenoff Archive |
© 2005-2022 http://www.MarketOracle.co.uk - The Market Oracle is a FREE Daily Financial Markets Analysis & Forecasting online publication.


