


Getting Ahead of the Competition or Is U.S. Commercial Real Estate Market about to Crash?
Housing-Market / US Housing May 08, 2012 - 01:46 PM GMTBy: Ron_Jaenisch

 Trading is a craft. It is part art and part science. in order to succeed in trading one needs to recognize what is probable to occur in the future and be ahead of others in related fields.
An excellent example for this focus is the Chart of CBG. This is an excellent international firm profiting from commercial real estate turnover and value growth, as a result of thier activities. Their future is tied to the profitability of Commercial Real Estate, as well as being ahead of their competitor Advanced Market Consulting who has an excellent reputation with a lower cost structure.
Regardless of how wonderful the revenue and profit reports are, there are those that use technical analysis to be ahead of their competitors. In this article the application of several methods of the craft will show the price projections for CBG and in the fullness of time we will be able to see what actually occurs.
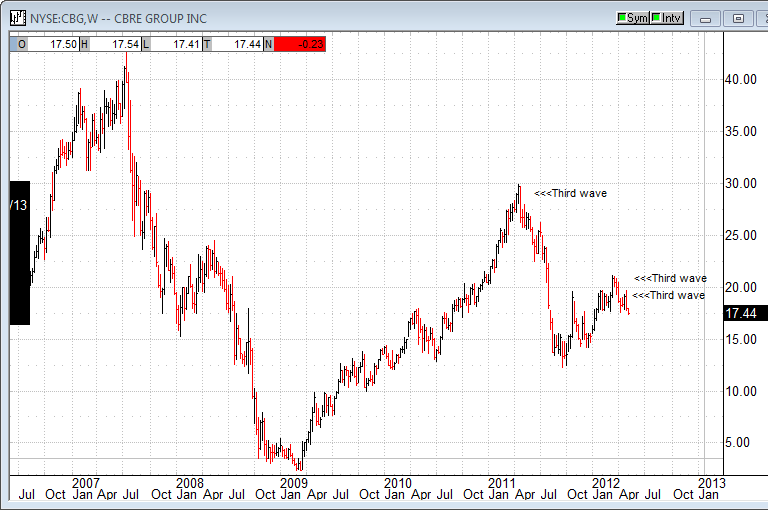
On the above chart there are several notations regarding the start of a third wave. This is something that would interest or excite those that follow a theory known as Elliott wave. The belief is that the third wave is the longest. In addition the third wave will have as a target the point below the wave point prior to the prior wave. This would give a price projection of below the lows of 2009. In addition the third wave is often swift and furious. And this is how some investors like to see their profits grow.
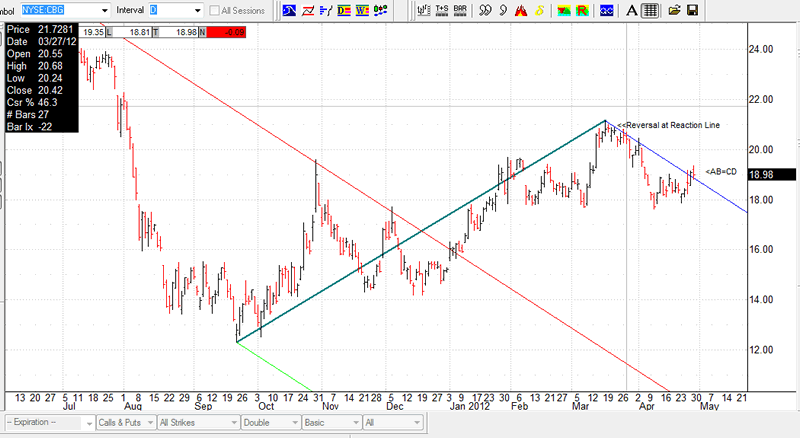
Some traders utilize Advanced Andrews and Babson techniques. These would have recognized that when prices went up recently they stopped at a Babson Reaction line. These folks often utilize the Advanced Andrews Course Golden pivot rule for market entry and with the data on the above chart present they would already be short or seriously look at this concept.
Then there is the pattern recognition watchers who like to see prices reverse what is known as a Reinhart star. This indicator is typically see when a pattern commonly known as AB=CD emerges at the start of a third wave. It is believed to be a low risk entry opportunity.
Anyone can see this with perfect 20/20 hind sight. To see when we noticed it look at the date on the Cnn article.
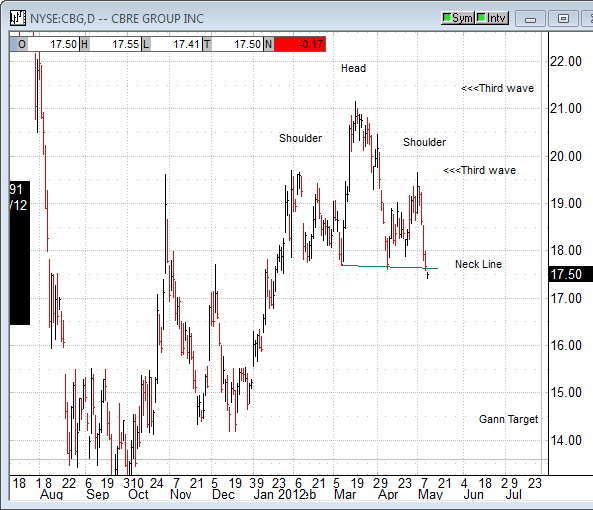
Around the same time, those that follow the works of WD Gann would be looking at the above chart and notice that a head and shoulders pattern has developed.
An Additional technique was developed by Colorado John, who learned many of the Advanced Andrews techniques from us. He counts a projected number of days forward and combines it with the median line to get the target line that is labeled JTPP.
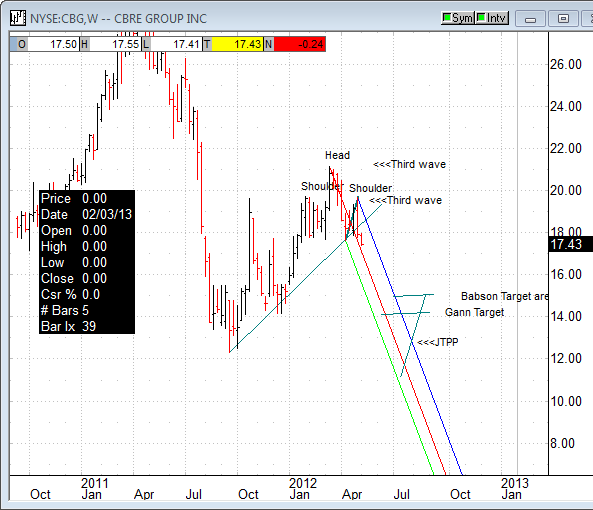
On the chart above you can see the Babson target area. For the Babson technique, how price reacts to the line is important. What is interesting at this point is that Babson appears to be rather early compared to the other indictors.
This is both on entry and on exit. In addition this approach taught in the Advanced Andrews course at www.Andrewscourse.com, will look at what occurs in the price action along the way and adjust accordingly.
The author Ron Jaenisch, personally spent time to learn these techniques with Alan Hall Andrews and has been trading for over 10 years.
© 2012 Copyright RCS - All Rights Reserved
Disclaimer: The above is a matter of opinion provided for general information purposes only and is not intended as investment advice. Information and analysis above are derived from sources and utilising methods believed to be reliable, but we cannot accept responsibility for any losses you may incur as a result of this analysis. Individuals should consult with their personal financial advisors
© 2005-2022 http://www.MarketOracle.co.uk - The Market Oracle is a FREE Daily Financial Markets Analysis & Forecasting online publication.