


Stock Market Sell in May and Go Away? Not this Year
Stock-Markets / Seasonal Trends May 01, 2012 - 03:42 AM GMTBy: Frank_Holmes

 One catchy investing maxim that's popular this time of year is "sell in May and go away," the notion that investors should cash in their investments and take the summer off. Historically, this hasn't been a bad strategy. You can see from this chart that June, July, August and September have been the worst four months of the year for the S&P 500 Index since 1988.
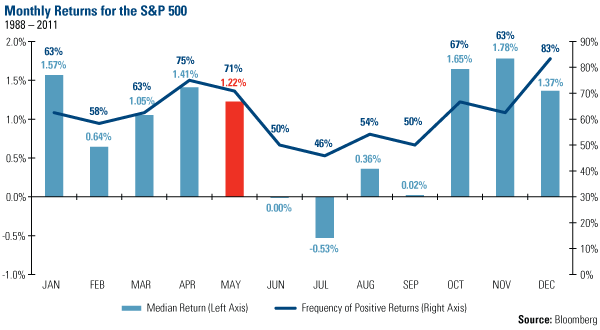
Since 2000, the June-September period for the S&P 500 is split. Half of the years saw positive returns, while the other half were negative. Historically, you have only about a fifty-fifty chance for a positive gain during those months while your odds are roughly 10 percent better during the rest of the year.
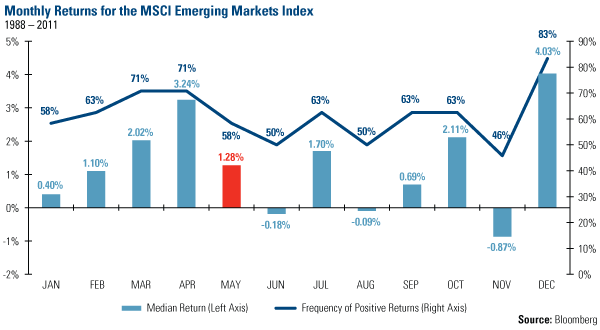
The trend is less consistent for emerging market stocks. You can see that the median monthly return for the MSCI Emerging Markets Index since 1988 is negative for June and August, but positive for July and September. The frequency of positive returns during the June-September period is roughly 6 percent lower than the rest of the year.
Last year, investors who employed the "sell in May" strategy averted an almost 17 percent drop in the S&P 500 and a nearly 25 percent drop in the MSCI Emerging Markets Index from June-September. Summer of 2010 was a similar experience.
With last year fresh on the minds of investors, should they take this summer off? We don't think so.
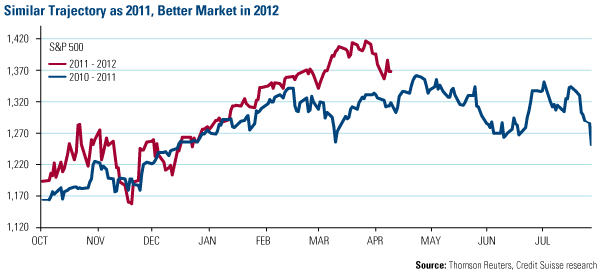
We believe it's a much better market this year. After following a similar trajectory as the previous year from October to the beginning of March, improving economic data pushed the S&P 500 over 3 percent higher in March 2012 after trending sideways during the same time period last year.
Real GDP in the U.S. grew 2.2 percent during the first quarter of 2012 versus 0.4 percent during the first quarter of 2011, and several areas of the economy are much stronger than they were a year ago. Nonfarm payrolls (up 29 percent), ISM Manufacturing (up 2 percent) and auto sales (up 8 percent) have all improved from a year ago, according to J.P. Morgan. In fact, auto sales are currently at a four-year high.
More importantly, the U.S. housing sector continues to improve. The ISI Group's homebuilders survey is currently at 50.4, nearly 40 percent higher than a year ago.
Building permits are 35 percent higher and the number of housing starts is 3 percent higher than a year ago, according to Credit Suisse. Sales of existing homes are up 5 percent on a year-over-year basis. Credit Suisse says, "The supply of existing one-family homes has fallen from a peak of 11.5 months in July 2010 to 6.3 months in March (in line with the 20-year average)."
ISI Group says an improvement in housing is important because it lifts consumer net worth and employment, which leads to rising consumer confidence. Housing accounts for just over 2 percent of U.S. GDP, but roughly 27 percent of household wealth, according to Credit Suisse.
Earnings Season Off to a Record Start
The improving global economy is reflected in the thirteenth-straight quarter of better-than-expected corporate earnings. As of Thursday, 80 percent of S&P 500 companies have reported earnings above analyst estimates. Earnings for the 260 companies reporting so far were up 11.4 percent year-over-year and beat the consensus estimate by 6.3 percent.
This is good news for shareholders. According to a *Bloomberg story this week, "companies are increasing shareholder returns in the form of dividends and buybacks after the 2008 financial crisis led them to hoard cash to a record $1 trillion by the end of 2011." The number of S&P 500 companies paying out dividends now sits at 401, the largest number since January 2000. Corporations bought back roughly $543 billion worth of shares in 2011 and J.P. Morgan estimates companies will purchase another $679 billion worth in 2012.
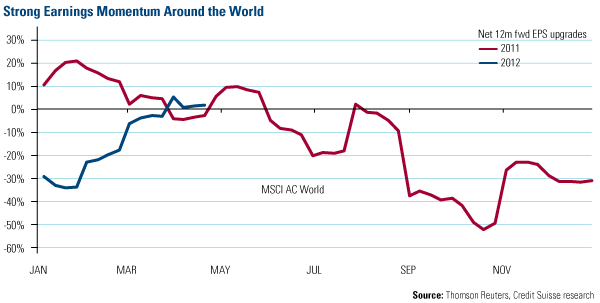
U.S. companies aren't the only ones reporting stronger results. This chart from Credit Suisse shows earnings momentum is strengthening around the world based on 12-month forward earnings per share estimates for the MSCI ACWI (All Company World Index). This is the opposite of what we experienced in 2011.
Buy in May?
May has historically been a strong one for markets. Since 1988, the median return for the S&P 500 and MSCI Emerging Markets during May has been 1.22 percent and 1.28 percent, respectively. In fact, May returns rank in the top half for both indices.
This is also a presidential election year in the U.S., which has historically produced positive returns. Since 1972, the stock market has rallied in 5 of the 8 election years, according to J.P. Morgan, with market gains of 12-26 percent. Only during recession years (2000 and 2008) did the S&P 500 provide negative returns.
Last week, Bank of America-Merrill Lynch suggested "investors position for an economic upturn" by increasing their exposure to equities. The firm's Global Wave indicator, a compilation of seven global metrics designed to provide a comprehensive assessment of trends in global economic activity, was signaling a trough in the global cycle. According to BofA-ML's research, the MSCI ACWI (All Country World Index) averages a 14.2 percent increase for the 12 months following a trough in the Global Wave. Historically, the index has experienced a positive return 86 percent of the time.
Instead of "selling in May and going away" for the summer in 2012, we think investors should look to global stock markets and ride the global wave.
For more updates on global investing from Frank and the rest of the U.S. Global Investors team, follow us on Twitter at www.twitter.com/USFunds or like us on Facebook at www.facebook.com/USFunds. You can also watch exclusive videos on what our research overseas has turned up on our YouTube channel at www.youtube.com/USFunds.
By Frank Holmes
CEO and Chief Investment Officer
U.S. Global Investors
U.S. Global Investors, Inc. is an investment management firm specializing in gold, natural resources, emerging markets and global infrastructure opportunities around the world. The company, headquartered in San Antonio, Texas, manages 13 no-load mutual funds in the U.S. Global Investors fund family, as well as funds for international clients.
All opinions expressed and data provided are subject to change without notice. Some of these opinions may not be appropriate to every investor.
Standard deviation is a measure of the dispersion of a set of data from its mean. The more spread apart the data, the higher the deviation. Standard deviation is also known as historical volatility. All opinions expressed and data provided are subject to change without notice. Some of these opinions may not be appropriate to every investor. The S&P 500 Stock Index is a widely recognized capitalization-weighted index of 500 common stock prices in U.S. companies. The NYSE Arca Gold BUGS (Basket of Unhedged Gold Stocks) Index (HUI) is a modified equal dollar weighted index of companies involved in gold mining. The HUI Index was designed to provide significant exposure to near term movements in gold prices by including companies that do not hedge their gold production beyond 1.5 years. The MSCI Emerging Markets Index is a free float-adjusted market capitalization index that is designed to measure equity market performance in the global emerging markets. The U.S. Trade Weighted Dollar Index provides a general indication of the international value of the U.S. dollar.
Frank Holmes Archive |
© 2005-2022 http://www.MarketOracle.co.uk - The Market Oracle is a FREE Daily Financial Markets Analysis & Forecasting online publication.