


Gold Mining Margins
Commodities / Gold & Silver Stocks Mar 02, 2012 - 12:37 PM GMTBy: Zeal_LLC

 The history of gold mining has been well-documented for thousands of years. And with the demand for this most precious of metals going nearly as far back as human history, miners have ventured to just about every corner of the planet in their quest to find it. Yet unlike the miners of yore that were commanded by kings, today’s miners are commanded by profits.
Like in any business, gold miners do what they do in order to make money. If they can sell their product for more than what it costs to produce, then they ought to see profits. But unlike any business, gold mining is a complex endeavor with a myriad of variables that can radically affect operations on virtually a daily basis. This makes miners’ financial affairs far from cut-and-dry.
Gold miners can’t just set up a factory anywhere they want to produce their product. They must go to the gold, which doesn’t always exist in optimal settings. Often these settings have big risk on a jurisdictional basis, within the borders of countries that may not have reliable or stable governing bodies and/or regulatory systems. And gold certainly doesn’t care if the rocks that hold it are located in harsh environments or rough terrains.
Operational settings present a whole different set of variables. Believe it or not, gold mining is not an exact science. Though geologists have come a long way in modeling deposits, engineers have come a long way in mine design, and metallurgists have come a long way in processing techniques, when you are dealing with the unseen there is just no way to completely avoid pitfalls.
No matter how many drill holes pierce a deposit, it is impossible to know the exact characteristics of every portion of an ore body. Though most operations are pretty well dialed in, if the rock types and/or grades don’t exactly line up with the mine plan, the economics can waver significantly.
But the biggest variable of all for the gold miners is price volatility. Unlike most other businesses that have some degree of control over how they price their products, sans hedging gold miners are slave to the daily futures activity of their underlying metal. If gold’s price is $100 lower from one week to the next, they get $100 less for their gold.
Nevertheless, the allure and beauty of this business is upside price potential. And in a secular bull market, the miners are more than willing to deal with all the variables involved in producing gold. From its low of $256 in 2001, gold is up an incredible 640% to its recent high. And as you can see in the chart below, gold’s ascent has been consistent and reliable now for a decade.
Commodities price volatility can drive miners batty. And in a bear market hedging, or selling production forward, only provides so much protection. If the miners don’t have quality assets and capital reserves, then not even the most intricate hedgebook can protect from insolvency over a long period of declining prices. In a bull market though, the miners tend to ditch their hedges and ride the wave to legendary profits. And this bull’s wave has been fantastic.
Since 2001 the annual average gold price has been up every year for 10 years running. And we’re not just talking a typical “cost-of-living” inflationary increase like you might see at your favorite retailer or restaurant. Over the last decade gold has been averaging a 19%+ year-over-year increase. If you’ve been investing in the physical metal like we recommended our newsletter subscribers do back in 2001, you’ve outperformed the markets tremendously.
As for the gold miners, they’ve had a pretty good run themselves. In fact, their stocks comprise one of the best-performing sectors of the last decade. The notion of profits leverage has made them incredibly attractive to investors and speculators, and thus many gold stocks have seen 1000%+ gains over this time, well outpacing gold.
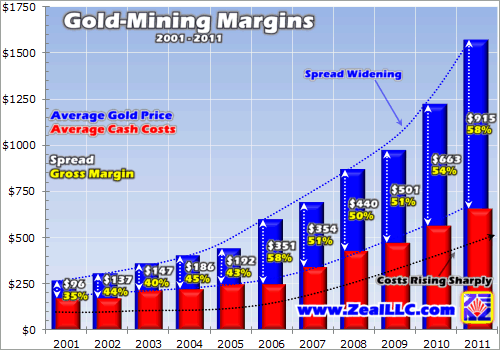
Costs are of course a key component of profits leverage. And as it is in every industry, cost is a four-letter-word for the gold miners. But for these miners, costs are a seemingly-uncontrollable phenomenon. As you can see in the red data series above, average cash costs are way up over the last decade.
These figures are compiled by averaging the cash costs of nearly two dozen of the world’s largest gold miners that have stock listings in the US. And with in-house historical data that catalogs these costs all the way back to the beginning of this bull, we can get an easy read on the prevailing trend. Also of note is since the producers responsible for this data cumulatively account for nearly half of global mined production, I believe these cash costs fairly represent the industry as a whole.
In looking at this chart, the first thing that catches most people’s eye is the incredibly-low cash costs at the beginning of this bull. Amazingly back in 2001 and 2002 the miners were producing their gold at sub-$180 cash costs. While low, these costs shouldn’t be that surprising considering where the price of gold was and what these miners had been through in the previous decade.
With where the price of gold is today, sometimes it’s easy to forget that from its near-$500 high in the beginning of 1988 to its 2001 low, gold’s price had been lopped in half. Over this stretch gold averaged $353, and in the four years leading up to and including 2001 it averaged a paltry $281. In gold’s brutal secular bear only those miners capable of running lean operations survived.
As the price of gold finally trended higher year-over-year, so did miners’ cost of production. And by 2005 cash costs had risen a staggering 45% to $250. But with 2005 marking a big inflection point for gold’s bull (its price had decisively pierced $500 for the first time in over 20 years), these rising costs were hardly a concern. Gold’s structural fundamentals remained rock solid, and the miners finally had faith in its new bull’s secular nature.
Going into 2007 cash costs really started to accelerate. And incredibly in the five years to 2011 costs have risen an average of 21% per year, or $81 per ounce. There are several reasons for these soaring costs, the most notable being rising input costs and diminishing ore quality.
On the input-cost front it is easy to overlook the energy-intensive nature of the mining business. Miners burn a lot of fuel powering their equipment and plants. And those lucky ones able to connect to a local power grid are not immune to rising costs either. Fuel/energy prices have skyrocketed in recent years!
Labor costs have also seen huge increases. Even in third-world countries the unions are successfully negotiating (often via menacing and intimidation tactics) pay raises many multiples higher. Rising costs are also prevalent in such inputs as water and cyanide.
But more impactful on cash costs than rising input costs is the type of ore that is being mined these days. With higher gold prices, the miners have been able to revive old mines and develop new mines that would not have been economical 3, 5, or 10 years ago. These deposits consist of lower-grade mineralization and higher-complexity ore, which obviously translates to higher per-ounce production costs.
Adding to this, many miners are intentionally low-grading their existing operations. As a rough example, let’s say an open-pit mine has a high-grade core of reserves that grade 0.14 ounces per ton. And surrounding this core is a lower-grade halo of reserves that grade 0.07 ounces per ton. Logically speaking the high-grade core would produce an ounce of gold at half the cash costs than the lower-grade material (assuming the same rock types and recoveries).
Well in order to preserve the higher-grade material for future times when gold prices may be lower, many miners will intentionally produce from the lower-grade reserves so long as the economics allow. Some miners believe it to be prudent to mine lower-grade ore at a cash cost of $650 rather than available higher-grade ore which may have cash costs of only $325. In both scenarios a miner will still make good money at $1700 gold.
As an “in-between”, some miners may blend the differing reserves to dilute the head grade. And some will even go as far as diluting their payable ore with waste rock to further preserve the good stuff! You won’t see many miners admit to these types of tactics, but it is an unwritten rule that has allowed some of the veterans to survive the unforgiving market cycles.
So with 2011’s average cash costs at $657, there has been a staggering 273% rise in costs over 10 years. In any other industry this type of cost increase would be totally unsustainable and unacceptable. But in the gold-mining industry, the miners have carried on like business as usual.
And as is apparent in this chart, gold miners can get away with sharply-rising costs thanks to sharply-rising gold prices. Even though in isolation these cost increases are painfully steep, from a margin perspective things appear to be going great for the gold miners.
By definition gross margin is the percent of revenue a miner retains after incurring the direct costs of producing an ounce of gold. In my crude example here, I simply used the average gold price and average cash costs in the formula. And as you can see, gold mining is a business that can generate some very healthy margins.
Also included in this chart is the raw dollar spread between the average gold price and average cash costs. And it is quite visually apparent that this spread has been widening over the course of gold’s bull. But provocatively in looking at the margins, we don’t see this same consistent widening.
Over the first five years of this gold bull gross margins were consistently flat, averaging 42%. Even though the spread grew by $100, rising cash costs curbed any potential widening of the margins. In 2006 margins then opened wide up, with a huge increase in the average gold price and a rare year-over-year stretch where cash costs were flat. This was the first real big taste of profits leverage for investors.
Since 2006 the gold miners have enjoyed gross margins in excess of 50%. But again rising cash costs have throttled margin growth. Even though the miners have seen their gross profit per ounce increase by an incredible $550+ since 2006, margins have remained flat.
Lack of margin growth aside, gold miners’ 2011 average gross margins of 58% are still spectacular. With numbers like this, these companies should be landing on a lot of investors’ radars. But 2011 was actually quite a rough year for gold stocks. Even though gold was up 10% on the year, the big gold-stock indices were down 10%+.
Unfortunately as mentioned things just aren’t that simple for the gold miners. While gross margins do tell a captivating story, they don’t tell the whole story. A brilliant tactic taken out of the pages of the oil companies, gross margins and cash costs are nothing but window dressing, eye candy that invites investors in for a closer look.
Interestingly cash costs are not the all-in production costs of mining an ounce of gold. And what is rolled into cash costs can vary from company to company. Thankfully there is some sense of uniformity that investors can cling to, with most miners submitting to a non-GAAP standard that was implemented by the Gold Institute back in 1996.
Under this standard, total cash costs are calculated by adding cash operating costs (direct mining expenses, stripping and mine-development adjustments, third-party smelting/refining/transportation costs, and credits from byproduct sales if applicable) to royalties and production taxes. And the per-ounce figure we see is calculated via dividing total cash costs by the total ounces of gold produced.
What these costs don’t include are non-cash expenses such as depreciation, depletion, and amortization, along with reclamation and mine-closure costs. They also don’t include the “effective cost” of replacing the reserves that are being mined. The miners are constantly in search of their next deposit, and it takes a big capital effort to do so.
So in reality, gross margins are truly gross. They don’t tell the complete story of a miner’s ability to generate cash, nor do they paint an accurate picture of the future. What they do tell us is the gold miners need high margins in order to survive, sustain, and grow their businesses.
But gross margin is still an important metric for investors to understand. Not only does it offer a read on how the industry is trending, it allows investors to recognize the higher-quality companies, the ones with lower cash costs and thus higher margins compared to their peers.
Overall while the miners have enjoyed a prolonged period of prosperity where higher gold prices are masking rising cash costs, investors might be starting to catch on to the fact that margins are not increasing as perhaps they should. This could be one of many reasons why gold stocks have been lagging recently.
Fortunately with gold’s fundamentals still rock solid a decade now into this bull, demand and thus prices should continue to trend higher in the years to come. And so long as the gold miners can control their costs, there is ample opportunity for margins to increase from here. Gold stocks ought to continue to positively leverage gold to the upside. And when they eventually catch a long-overdue bid, those quality ones that are on the low side of the cash-cost average and high side of the gross-margin average will perform the best.
At Zeal we favor the smaller companies to outperform in any upleg, which is why our newsletters are heavily positioned in low-cost high-margin junior producers that were profiled in our recent research report. Subscribe today to our weekly or monthly newsletters to find out which gold stocks we are trading. And by becoming a subscriber not only will you get trade recommendations, you’ll gain unique contrarian commentary and analysis that will be sure to grow your market knowledge.
The bottom line is gold mining is like any other business in the sense that the miners are driven to make money. And considering what the price of gold has done in the last decade, this effort shouldn’t have been too difficult. But in gold mining, nothing is easy.
While many miners have capitalized on gold’s bull, as a group they’ve struggled controlling costs. And in balancing external forces they can’t control with internal forces they can, these cost challenges have limited their ability to grow margins. Thankfully we are still in a gold environment where its miners can thrive.
By Scott Wright
So how can you profit from this information? We publish an acclaimed monthly newsletter, Zeal Intelligence , that details exactly what we are doing in terms of actual stock and options trading based on all the lessons we have learned in our market research as well as provides in-depth market analysis and commentary. Please consider joining us each month at … www.zealllc.com/subscribe.htm
Thoughts, comments, or flames? Fire away at scottq@zealllc.com . Depending on the volume of feedback I may not have time to respond personally, but I will read all messages. Thanks!
Copyright 2000 - 2012 Zeal Research ( www.ZealLLC.com )
Zeal_LLC Archive |
© 2005-2022 http://www.MarketOracle.co.uk - The Market Oracle is a FREE Daily Financial Markets Analysis & Forecasting online publication.