


U.S. Housing Market Sideways Trend Reflects Underlying Soft Labor Market Situation
Housing-Market / US Housing Nov 18, 2011 - 01:54 AM GMTBy: Asha_Bangalore

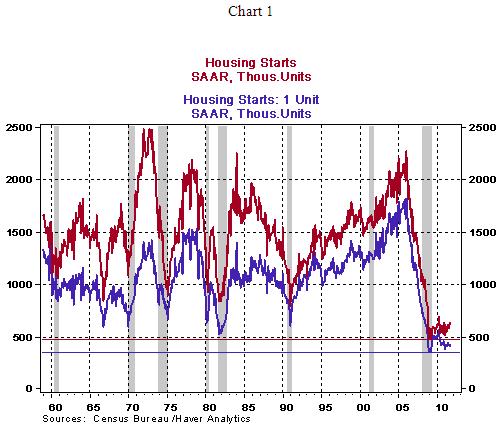
 Builders broke ground to construct new single-family homes (+3.9%) in October, but starts of multi-family units slipped 8.3%. Total housing starts fell slightly (-0.3%) to an annual rate of 628,000 in October. The important point to note is that total and single-family starts of new homes continue to hover around levels seen in the past recession (see Chart 1), which are also historical lows. Starts of single-family units stood at 430,000 in October 2011 vs. 353,000 in March 2009 (historical low).
Permits issued for new homes rose 5.1%, while it climbed 24.4% for multi-family units. Unlike in prior post-war recessions, the housing sector is not one of the drivers of economic growth, as yet.
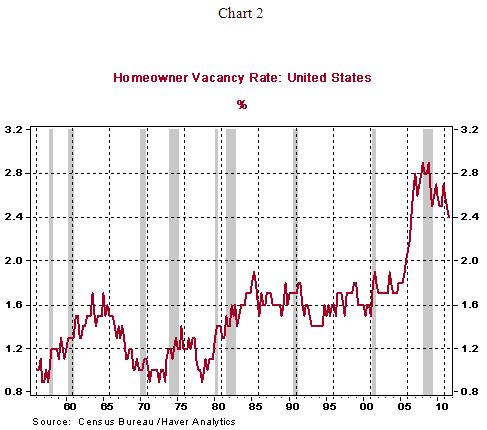
Although the homeowner vacancy rate has dropped to 2.4% in the third quarter from a high of 2.9% in the fourth quarter of 2008 (see Chart 2). The elevated level of the homeowner vacancy rate is a deterrent of new construction, in addition to the soft employment situation.
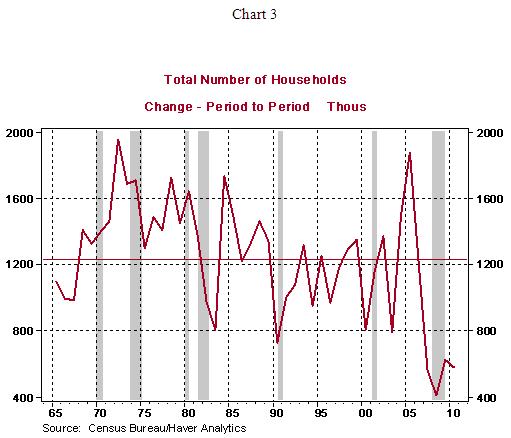
The sluggish pace of GDP growth in the recovery and severely weak conditions of hiring have held back household formation in the three years ended 2010. The historical average for new household formation is 1.236 million households per year. During 2008, 2009, and 2010, the increase in households was 414,000, 624,000 and 581,000, respectively, which is well short of the historical average (see Chart 3) for three straight years. In other words, until employment conditions show robust monthly gains for an extended period, the demand for homes is expected to be tepid.
Asha Bangalore — Senior Vice President and Economist
http://www.northerntrust.com
Asha Bangalore is Vice President and Economist at The Northern Trust Company, Chicago. Prior to joining the bank in 1994, she was Consultant to savings and loan institutions and commercial banks at Financial & Economic Strategies Corporation, Chicago.
Copyright © 2011 Asha Bangalore
The opinions expressed herein are those of the author and do not necessarily represent the views of The Northern Trust Company. The Northern Trust Company does not warrant the accuracy or completeness of information contained herein, such information is subject to change and is not intended to influence your investment decisions.
© 2005-2022 http://www.MarketOracle.co.uk - The Market Oracle is a FREE Daily Financial Markets Analysis & Forecasting online publication.