Are Gold Stocks Facing Another 2008 Crash?
Commodities / Gold & Silver Stocks Jun 22, 2011 - 05:25 AM GMTBy: Jordan_Roy_Byrne
 In a word, no. We divide our rationale into three parts.
Macro : Back in 2008, a recession was beginning, the private sector was in intense deleveraging mode and the credit markets foreshadowed what was to come in the equity and commodity markets. Today we are seeing growing credit stress on the sovereign side and not in the private sector as we had in 2008. Certainly there are issues with banks but its impossible to see a repeat of 2008 when major liquidation, bankruptcies and layoffs already happened. They can and will happen again but the scale would be much smaller and so would the effect on capital markets.
A private sector credit contraction is deflationary because the private sector can't monetize its debts or take on more debt. Therefore it curtails risk and sells assets in order to deleverage. Credit problems on the sovereign side have inflationary implications. Sure governments do sell some assets but that is in dire circumstances. It's far easier to restructure, monetize and/or take on more debt or default. In each and every case, the currency loses value and inflation rages.
Those who expect another 2008 seem to ignore that the private sector crisis already happened. The next act(s) is the sovereign debt crisis in Europe, Japan and eventually the US.
Sentiment
Also, we want a key difference in sentiment. In 2008, sentiment remained quite bullish on Gold and Silver for several months after the March peak. Today Gold and Silver are trading off their highs but sentiment figures reflect more caution or indifference. Here are some figures.
In 2008, public opinion on Gold peaked at 85% bulls in March and then at 79% bulls in July. Today it is at 66% bulls. The peak of the speculative long position in July 2008 was only 3% below the peak in March. Today, the speculative long position is 22% below its recent peak of late 2010.
In 2008, public opinion on Silver peaked at 88% bulls and then at 73% bulls in July. Today, it is at 39% bulls. The speculative long position peaked in July 2008 only 6% below its peak in March. Today, the speculative long position is not only 43% below its peak in February but its sitting at a two-year low.
Furthermore, assets in the Rydex Precious Metals Fund have declined 61% since the start of the year! Assets are currently at a two-year low!
Profit Margins
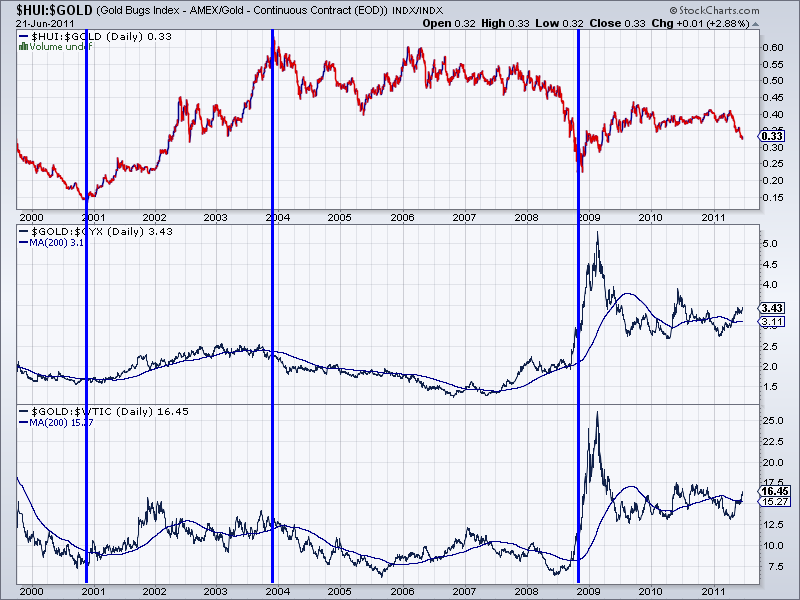
To get a handle on miner profit margins we look at Gold/Oil and Gold/Industrial Metals which are fairly reliable leading indicators for miner profit margins. Below is the chart...

We use a 200-day moving average to smooth out the volatility. In the summer of 2008, the 200-day MA of the Gold/Oil ratio was about 8. Its presently at 15 which aside from early 2009, is at a 10-year high. The Gold/Industrial Metals ratio in the summer of 2008 was at 2.0. It's now at 3.11. In 2007-2008, the ratios were near four-year lows and that was reflected in the weak relative performance of gold stocks. Note that the ratios began rising in summer 2008 and then a few months later, gold stocks rocketed higher in nominal terms and relative to Gold. These ratios have been rising for several months and if it continues, we should expect gold stocks to strengthen against Gold.
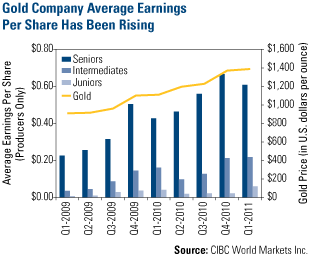
The high long-term levels in these ratios indicates that profit margins should be strong as is. Below is a chart from Frank Holmes and CIBC that shows earnings have been steadily increasing across the entire sector. In recent quarters the intermediates and juniors have shown the strongest earnings growth.

Conclusion
The differences between today and 2008 (with respect to the gold shares) are evident on both a micro and macroeconomic spectrum. In 2008, sentiment was too bullish on Gold and Silver while fundamentals for the mining equities were deteriorating as a result of high Oil and high inflation. Today, fundamentals remain as strong as ever and are likely to improve thanks to Gold and Silver outpacing mining cost inputs. Meanwhile, sentiment indicators are extremely favorable for both the metals and the shares. Finally, the big picture has shifted. The shock of the private sector credit crisis has passed while the sovereign debt crisis is next on stage.
Simply put, we have seen a correction or retracement of the massive gains of the past few years. There may be more backing and filling for a few months before the sector begins its next impulsive advance. Investors should now be in accumulation mode as we see significantly higher prices six and twelve months down the road.To find out more about how we manage risk and volatility and what stocks we are following, then consider a free 14-day trial to our premium service.
Good Luck!
Jordan Roy-Byrne, CMT
Trendsman@Trendsman.com
Subscription Service
Trendsman” is an affiliate member of the Market Technicians Association (MTA) and is enrolled in their CMT Program, which certifies professionals in the field of technical analysis. He will be taking the final exam in Spring 07. Trendsman focuses on technical analysis but analyzes fundamentals and investor psychology in tandem with the charts. He credits his success to an immense love of the markets and an insatiable thirst for knowledge and profits.
© 2005-2022 http://www.MarketOracle.co.uk - The Market Oracle is a FREE Daily Financial Markets Analysis & Forecasting online publication.


