


Stock Market S&P500 Cycle Analysis Update
Stock-Markets / Cycles Analysis May 20, 2011 - 03:16 PM GMTBy: readtheticker

 What leads, technicals or fundamentals? Does a price chart discount all fundamentals? These debates rage on, but I can say with the utmost accuracy that cycles are great for predicting in the next explosion of activity. A rally or a sell off, no matter cycles have an uncanny knack of being on the money when either is in the infant stages.
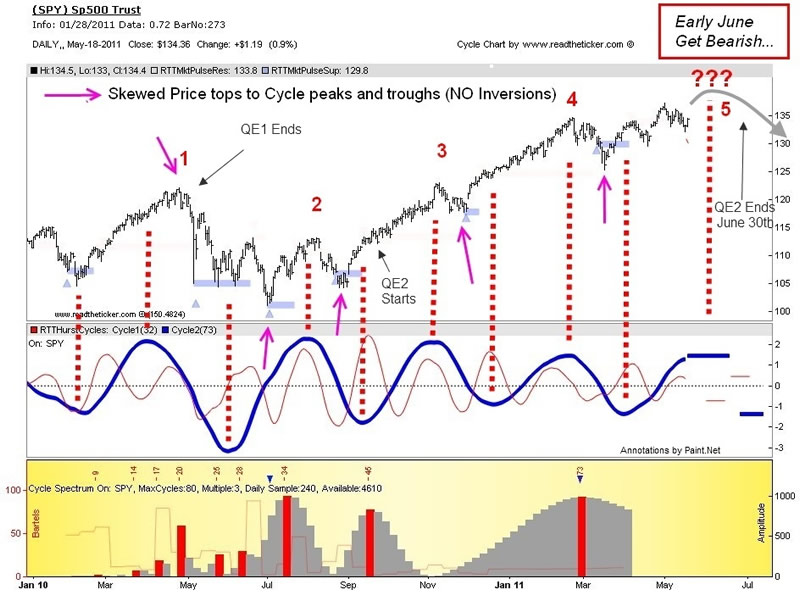
The latest cycle for the SP500 chart is below. The trend has been up and I have numbered the cycle tops from 1 to 5 in heavy red. One was the news of Greek debt issues, or more precisely QE1 ending, four was the Japanese Tsunami, two and three were not material. What will 5 be? I am not sure yet, but mostly likely the pricing in of QE2 ending masked in another euro debt story just to fool the mums and pops.
We are never keen to trade cycle peaks that are against the trend, but this time I feel its different. Should five be more like one, as both are consulted by the ending of a QE episode. I am not saying a flash crash is to be upon us (but never say never), but we are due for a doosie. I would not take a position base on the Hurst cycle roll over alone, I would need to see confirmation by some selling by the big boys first (via our tool RTT TrendPower). Watching and waiting.
SPY Cycle
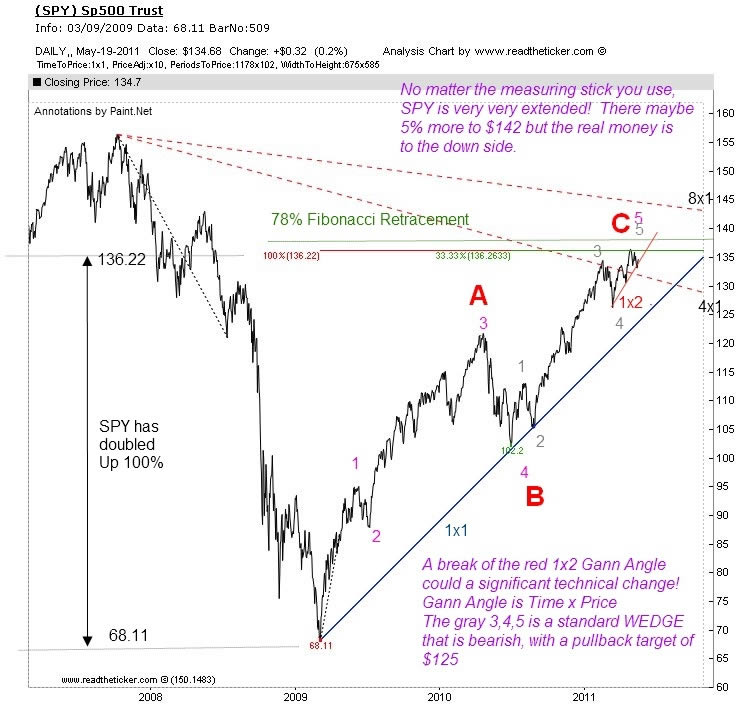
SPY Gann Angle
Fundamentals are rolling over to bearish
Readtheticker
My website: www.readtheticker.com
My blog: http://www.readtheticker.com/Pages/Blog1.aspx
We are financial market enthusiast using methods expressed by the Gann, Hurst and Wyckoff with a few of our own proprietary tools. Readtheticker.com provides online stock and index charts with commentary. We are not brokers, bankers, financial planners, hedge fund traders or investment advisors, we are private investors
© 2011 Copyright readtheticker - All Rights Reserved
Disclaimer: The material is presented for educational purposes only and may contain errors or omissions and are subject to change without notice. Readtheticker.com (or 'RTT') members and or associates are NOT responsible for any actions you may take on any comments, advice,annotations or advertisement presented in this content. This material is not presented to be a recommendation to buy or sell any financial instrument (including but not limited to stocks, forex, options, bonds or futures, on any exchange in the world) or as 'investment advice'. Readtheticker.com members may have a position in any company or security mentioned herein.
© 2005-2022 http://www.MarketOracle.co.uk - The Market Oracle is a FREE Daily Financial Markets Analysis & Forecasting online publication.