


Gold Stocks Stuck in Consolidation
Commodities / Gold & Silver Stocks May 12, 2011 - 04:20 AM GMTBy: Jordan_Roy_Byrne

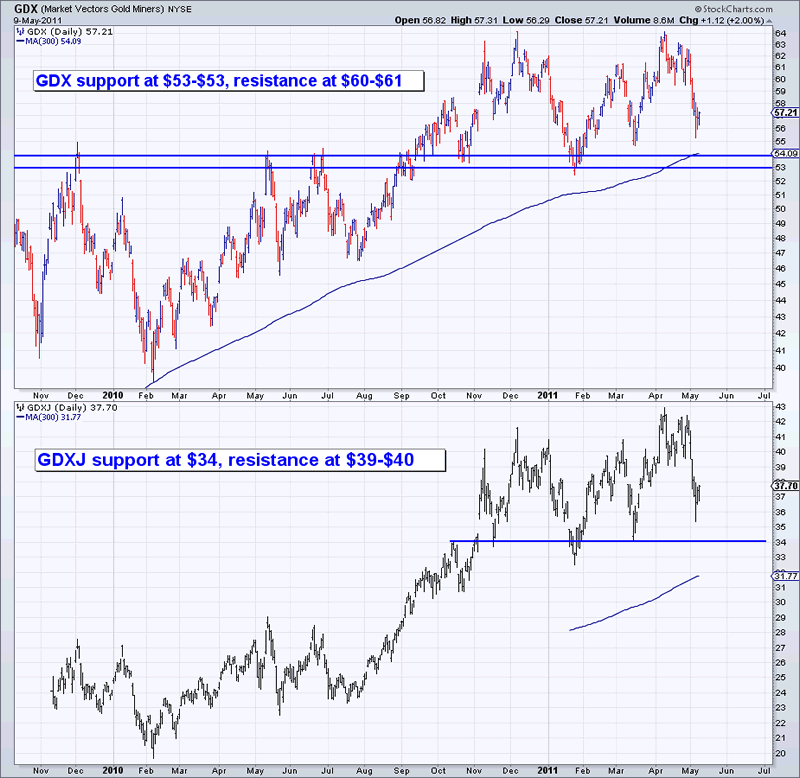
 Though Gold and Silver were able to make new highs in recent months, the gold stocks (as evidenced by GDX (large caps) and GDXJ (larger juniors) never did. We wrote of their relative weakness and how it was a warning sign for the sector. The shares failed to breakout and have fallen back into their consolidations at a time when the sector tends to consolidate and correct.
Below we show GDX and GDXJ. For each chart we show the 300-day MA and support and resistance points.
We also have a chart from sentimentrader.com, which tracks the assets in Rydex' Precious Metals Fund. It is a sentiment indicator.
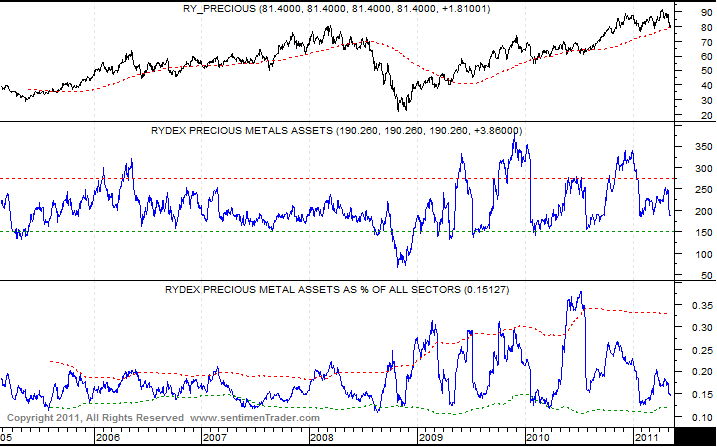
Note that both the assets in the fund (nominally) and assets relative to other sectors are way below their highs. In fact, they are closer to their lows.
The financial media, day trading types and retail crowd have now forgotten about the sector. Should you? Absolutely not. This is when the real professionals make money and when the average Joe's struggle.
The typical trader and investor loves to buy strength. There is nothing wrong with that. However, gold stocks are a different animal. There are numerous false breakouts and false breakdowns. For example, GDXJ gave us a false breakout last month. In 2010, GDXJ had a false breakout in May. The best strategy for a volatile sector in a bull market is to use the volatility to your advantage.
Let's use GDXJ as an example. The market is at $37 with support at $33-$34 and resistance at $39-$40. If you have some patience, you can can buy at $34-$35 and wait for a potential breakout. If the market breaks below $33, you can sell. However, if you wait for a break of $39-$40, then you are already missing out on some upside. Need we mention that a buy at $34-$35 carries less risk because it executes at technical support and likely when sentiment is not positive.
Apply this to your favorite large and junior gold stocks. Identify points of support. If the precious metals follow their typical seasonal pattern, odds are you will have a few chances to nab your favorites at a time when others are panicking and you see articles about a crash or an end to the bull market or, excuse me, the "gold trade." If this analysis interests you then we invite you to a free 14-day trial to our premium service.
Good Luck!
Jordan Roy-Byrne, CMT
Trendsman@Trendsman.com
Subscription Service
Trendsman” is an affiliate member of the Market Technicians Association (MTA) and is enrolled in their CMT Program, which certifies professionals in the field of technical analysis. He will be taking the final exam in Spring 07. Trendsman focuses on technical analysis but analyzes fundamentals and investor psychology in tandem with the charts. He credits his success to an immense love of the markets and an insatiable thirst for knowledge and profits.
© 2005-2022 http://www.MarketOracle.co.uk - The Market Oracle is a FREE Daily Financial Markets Analysis & Forecasting online publication.