


A look at the Stock Market Cycles and Gold
Stock-Markets / Cycles Analysis Sep 23, 2010 - 11:06 AM GMTBy: Clif_Droke

 Now that we’re only two weeks or less away from the 4-year cycle bottom, it’s time to start thinking about the year-ahead outlook and what the coming months may bring. This year has been a rough one in patches due in no little measure to the influence to the 4-year down cycle. In previous years when the 4-year cycle has bottomed by itself it has tended to be rather mild in terms of the bottom itself (the cycle always bottoms around late September/early October) but has always created turbulence for the stock market in the months leading up to its bottom.
It’s a mistake to think that the stock market’s direction is absolutely determined by cycles in the short-term. The most important determinant of the short-term direction of stock prices is investor psychology/confidence. This in turn leads to money flow, which is the basis behind momentum. This is why we put greater emphasis on the short-term technical indicators for trading purposes rather than having our trading dictated by the cycles. Traders who trade solely by the cycles tend to be on the wrong side of the trade more often than they would like to admit.
The last time the 4- year cycle bottomed was in late September 2006 and it turned out to be an event that was essentially shrugged off by the stock market but not before the S&P took a dive in May-June. At the time I wrote that it was more than likely a “bottom in price before a bottom in time,” which is what it turned out to be. While the cycle purists were either in cash or on the short side of the market in the summer and fall of 2006 as they awaited the 4-year cycle bottom which they felt sure would collapse the market, the internal momentum indicators told us to buy. Internal momentum outranks the cycles for trading purposes in all but the most extremely bearish market environments.
Probably the best analog I can produce to compare the present market environment to a similar point in the past would be 2004. The year 2004, like this year, was an election year and investors were holding their collective breaths over the outcome of the fall elections. The market had a rough ride in 2004 since the 10-year cycle was down that year and was scheduled to bottom in late September that year. But instead of the S&P making its final low in September the final low was actually made in August as you can see in the chart below. The 4-year cycle bottom in late September was a rather mild affair. A final pullback into late October when the dominant interim weekly cycle bottomed was the last correction before the market took off. After that point the market’s internal momentum showed continual improvement and stocks leapt into November when it became clear to the Wall Street insiders who would win the presidential election.
Another worthwhile comparison between now and previous cycle bottoms would be the 4-year cycle bottom year of 1982. Then, as now, the market apparently wrung out enough of the technical and psychological excesses between the months of May and August that the cycle bottom in late September proved to be an extremely muted affair. The Dow Industrials traced out a similar pattern in 1982 (albeit a less volatile one) to the one from this year, with an early May peak followed by a final low in August. The 4-year cycle bottom in late September that year barely registered and by that time the market was on its way to higher levels well into the fourth quarter.
Along those lines, a subscriber writes, “With the 2 year cycle and 4 year cycle still in play before 2014, can the potential upcoming rally really be sustained or even make new highs knowing that so many cycles should be in their down phase until 2014?”
The 2-year cycle is the half cycle component of the 4-year cycle which bottoms in just two weeks. After this month both the 2-year cycle will be up until next September along with the 4-year cycle and 6-year cycle (which also peaks next September). With these three key cycles in the up phase heading into 2011, the stock market should have enough of an impulse to keep the recovery alive and make headway through most of 2011 before the 6-year cycle peaks a year from now.
This wouldn’t be unprecedented since the Axe Houghton stock market index (a precursor to the Dow Jones Industrials) was seen to rally to new highs into the year 1892 – just two years before the previous 120-year cycle bottomed in 1894. The next 120-year cycle bottom will of course be seen in 2014.
Gold Stocks
Gold stocks are becoming overheated according to the latest reading of the XAU 20-day price oscillator. On Wednesday the 20-day oscillator reached an extremely high reading of +25, the highest since the previous short-term market top in August. A reading of +20 or higher has only been seen two other times this year – in both cases the XAU was at or very near a price peak and ended up correcting shortly there after (the previous occurrences were in March and June). See the indicator chart below.
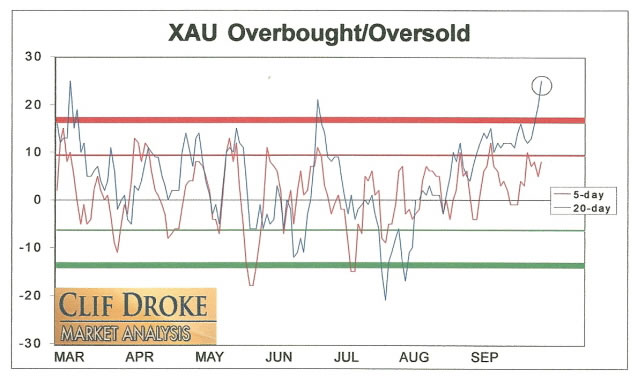
The fact that the gold stocks are currently overheated isn’t a sell signal but it does tell us that we need to keep a close watch on this market by utilizing conservative stop losses on all our trading positions and also to take some profit on recent gains. The overbought reading in the 20-day oscillator also means we’ll need to wait until initiating new long positions as this isn’t the optimal time for that. We’ll wait for the oscillator to show us the market has cooled off before looking to purchase any new positions.
Meanwhile the SPDR Gold Trust ETF (GLD), our proxy for the gold price, has made yet another new high and is still benefiting from strong fund inflows as investors worry about the economic outlook. Gold isn’t a crisis hedge as much as it is a barometer of concern and worry. As long as uncertainty remains high over the direction of the U.S. economy, gold will continue to benefit.
Technical Analysis
Technical analysis is one of the most important and powerful tools for capturing gains in the stock market. When applied properly it can simplify the stock picking procedure, making it easier to identify the stocks that have the biggest potential for capital appreciation. Technical analysis is also of tremendous benefit in capital preservation as it enables the investor to identify the best price levels for setting stop-loss or exit points as well as identifying the best entry points for initiating a trading position.
Technical analysis is also helpful to investors in their search for the stocks and industry groups with the highest potential for achieving gains. By learning to properly read the charts and technical indicators of actively traded stocks, an investor who relies mainly on fundamental analysis will be able to more efficiently focus his time in researching the most promising company’s stocks while eliminating those which lack appreciation potential. In this regard, technical analysis is a most remarkable tool to use in conjunction with conventional fundamental research.
Several years ago I decided to write a book which distilled technical analysis to its essence. The book explains in easy-to-understand language the basics of chart reading. It also explains in simplified terms how to use the most useful of the technical indicators when analyzing stock charts. The aptly titled book, “Technical Analysis Simplified,” is still in print and has helped many traders and investors improve their performance in the stock market.
The book is now available for sale at: http://www.clifdroke.com/books/book03.mgi
Order today and receive as an added bonus a free 1-month subscription to the Silver Strategies Review newsletter.
By Clif Droke
www.clifdroke.com
Clif Droke is the editor of the daily Gold & Silver Stock Report. Published daily since 2002, the report provides forecasts and analysis of the leading gold, silver, uranium and energy stocks from a short-term technical standpoint. He is also the author of numerous books, including 'How to Read Chart Patterns for Greater Profits.' For more information visit www.clifdroke.com
Clif Droke Archive |
© 2005-2022 http://www.MarketOracle.co.uk - The Market Oracle is a FREE Daily Financial Markets Analysis & Forecasting online publication.