


Investors Profit From Master Limited Partnerships (MLPs) High Compound Annual Returns
Companies / Dividends Jul 14, 2010 - 12:48 AM GMT

 Master Limited Partnerships (MLPs) have delivered compound annual returns of 18.5% over the last 10 years. That's about 6% more than income trusts and 7% better than utilities—and most investment-grade MLPs maintain, and sometimes even grow, cash distributions in stressed markets. MLPs remain sensitive to global economic volatility, but some defensive-oriented MLP names still have strong growth characteristics in their distribution outlook. In this exclusive interview with The Energy Report, Morgan Keegan Analyst John Edwards provides a selection of "defensive-oriented" MLPs for you to choose from.
The Energy Report: The Alerian MLP Total Return Index has had three straight weeks of growth, rallying almost 9% from its closing low of 752.35 on May 20. It remains about 4.4% below the all-time high set in April. What are the fundamentals underpinning this boom period for MLPs?
John Edwards: I don't know if I would describe this as a boom. It's more a recovery from a dip. The sector did set a high on April 26; then there was a retrenchment. A variety of factors contributed to that, not the least of which is that the sector might have gotten a bit ahead of itself. We think that investors need to continue to be mindful of the sovereign debt risks that exist in Europe. We believe there's a pretty strong correlation to that being a contributing factor to market volatility, as it poses risks for deflation. Deflation in turn means it poses risks to the banking system over there. In turn, higher volatility is strongly correlated with yield spreads on MLPs. We've seen yield spreads widen out a bit, but obviously we're seeing volatility in the Chicago Board Options Exchange Volatility Index (VIX). That's come down a bit, so we've seen MLPs come back a bit from where they were. They have pulled back 6% to 8%. Now we're starting to make headway back toward the highs.
TER: John, you said in a June 15 report that "downside protection to the double-dip recession scenario" was among the attractions to investing in MLPs, but later in that same report you talk about, as you talked about earlier in this interview, sovereign debt issues posing risks to MLPs. So how can MLPs be double-dip recession proof and at the same time be very sensitive global economic events?
JE: On its face it might appear to be a contradiction, but it's really not. The reason is that most of the MLPs have done a lot of work to get their balance sheets in shape. There's been a lot of capital markets activity. So far this year, the capital markets activity has been significantly ahead of actual expectations for capital spending. Given that, we view MLPs as providing attractive downside protection because there's not going to be as much demand for capital going forward. The other factor is that MLPs, even during times when markets were extremely stressed, particularly investment-grade MLPs, were able to access capital markets, while some of the smaller names were not able to access capital at any price. We think that MLPs have proven themselves during very stressful financial times. In particular, the large caps with large asset bases and large integrated footprints have demonstrated they can function very well when a defensive orientation is required and were able to deliver on their distributions and, in many instances, grow their distributions through the challenging times. But we are mindful that when markets are stressed, yield spreads widen out, pushing MLP valuations down and as such, for the longer term, we advocate the higher-quality names.
TER: Well, that certainly was the case during the market crash of 2008. But how did MLPs fare in the 2000 crash and even further back?
JE: We can look at 2000. You had a technology bubble at that time. There's a very heavy retail component to investors in MLPs, which is still over 40% of the capitalization today. We believe a lot of retail investors were moving out of MLPs into high-growth technology plays right when the technology bubble was peaking, so MLPs did not perform particularly well back then. Following the collapse of the NASDAQ, MLPs actually performed extremely well as there was significant rotation back into the sector. Then, if you go all the way back to the 1980s, there were very few MLPs in existence, so it does not make a lot of sense analytically to look at what happened then as a guide for trying to make assessments today.
TER: What's the biggest competition for MLPs as far as investment dollars? Is it utilities? Is it bonds?
JE: I think it's both. I think MLPs are viewed as an alternative to bonds and alternative to utilities and REITs.
TER: So why should an investor choose an MLP over bonds or utilities or income trusts?
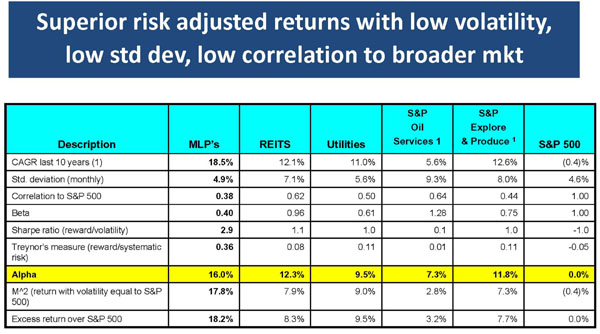
Source: Factset, Alerian.com, MK estimates
Note 1: Returns for 5/31/00–5/28/10 except Oil Services and E&P since Dec 31, 2000
JE: That's a great question. There are a number of reasons. If you look at MLPs compared to REITs or utilities, which are the most common things they get compared to, MLPs over the last 10 years have delivered compound returns of about 18.5% (that's assuming a market-cap-weighted total return calculation). It would be higher if you used an equal-weighted total return calculation. REITs have delivered 12.1% returns compounded; utilities, 11%. That's through the end of May 2010.
The standard deviation for MLPs is lower at 4.9%; REITs, 7.1%; utilities, 5.6%. The correlation to the S&P 500 is also lower so it provides a better diversification benefit. It's 0.38 for MLPs against 0.625 for utilities. The beta is also lower. It's only 0.4 times; REITs are close to the market; utilities, 0.6 times. The reward to volatility, the sharp ratio, is significantly higher. The reward to systemic risk is also significantly higher. Then when we calculate the alpha it's significantly higher. We're calculating a 16% alpha for the MLPs sector; 12.3% for REITs; and 9.5% for utilities. If you make the volatility equal to the S&P 500, the outperformance is even more dramatic. The excess return over the S&P 500 is huge. For all those reasons, we think MLPs remain a pretty compelling asset class for investors to consider.
TER: In a June research report you said, "We continue to advise focusing on investment- grade names with a large asset footprint, diversified cash flow, proven ability to raise capital and limited commodity exposure." With that in mind you recommend the following large caps: Kinder Morgan Energy Partners, L.P. (NYSE:KMP), Enterprise Products Partners, L.P. (NYSE:EPD) and Plains All American Pipeline, L.P. (NYSE:PAA). Please tell us about those companies.
JE: We believe those companies fit the majority of the characteristics you mentioned. Enterprise Products has the largest market cap of any MLP in the sector. Kinder Morgan has the second largest market cap. They have proven their ability to access capital markets during very challenging times as we saw in 2008 and 2009. They both fit the bill in terms of being very large, having diverse cash flow, etc. They both have some commodity exposure, so they don't completely meet that metric, but we think that's more than offset by all the positives and their proven track records.
Plains All American? They've also demonstrated very good performance during times of stress. It's largely a fee-based business with low exposure to commodity prices. We basically consider these companies more or less core holdings in the MLP sector. Obviously, with Kinder Morgan Energy Partners you can also own it under an alternative security ticker, KMR. It is actually economically equivalent to KMP, but instead of getting a distribution, you get paid in more stock.
TER: So it's Kinder Morgan Management, LLC (NYSE:KMR)?
JE: Yes. The stock is functionally equivalent to a unit in KMP. Each share of stock is used to purchase a unit of KMP.
TER: On the Morgan Keegan website it says that your company's research efforts focus on "the undiscovered growing firms striving to be tomorrow's blue chip stocks." Are there some of those in the mid-cap MLPs space?
JE: Since we know about them I can't really call them undiscovered, but there are some growth MLP opportunities. But given our macro view of the sovereign debt risk and sovereign credit risk that exist today, we suggest investors be defensively-oriented. Nonetheless, there are still some companies in the MLP world that have defensive characteristics, but still have what we believe are strong growth characteristics in their distribution outlook. One name that we like in that regard is Spectra Energy Partners, L.P. (NYSE:SEP). It has very low, if any, commodity risk. It's mostly contracted pipeline and hub pipe assets.
We also like Inergy, L.P. (NYSE:NRGY). It has a company general partner in Inergy Holdings, L.P. (NYSE:NRGP). Its assets are involved in the propane business—propane distribution, as well as a midstream. The cash flow derived from propane is roughly 60% of the total; the other 40% is from their midstream, gas storage and pipeline assets. It's very defensive oriented, very well positioned. It has a 6% distribution growth outlook for the next several years. Its company general partner has distribution growth prospects well into the double digits. Those are some that offer particularly good opportunities.
TER: Any others?
JE: There are a couple of others where we think the distribution growth is well above average. Sunoco Logistics Partners, L.P. (NYSE:SXL) is one. It's sort of a smaller version of Plains All American in that it's strong in terminals, storage and crude oil transport. It also has a little bit different mix. It also has products pipelines transport, for example.
We also like MarkWest Energy Partners, L.P. (NYSE:MWE) in that is has a lot of assets in the Marcellus Shale play where they effectively have a first-mover advantage in terms of being an independent mid-stream infrastructure provider there. We think distribution growth, which has been flat recently as they continue to invest capital and strengthen their balance sheet, should start to pick up in 2011 and should average better distribution growth from that point forward because of their asset position. The caveat is that they have greater commodity exposure than some of the larger cap names.
Another smaller cap play that we like is Genesis Energy, L.P. (NYSE:GEL). They have a somewhat diversified asset footprint but very strong balance sheet, very strong distribution coverage and sustainable distribution growth outlook in the 8%–9% range. That gives you some tickers we think people should consider.
TER: What are some of your favorite General Partner (GP) MLPs?
JE: I already mentioned one, NRGP, which is the general partner to Inergy L.P. NRGP has the incentive distribution rights to NRGY. That's why we're looking for very strong distributions, mid- to upper-teens for the next three years. We also cover Energy Transfer Equity, L.P. (NYSE:ETE) and Enterprise GP Holdings, L.P. (NYSE:EPE), which is the GP to Enterprise Products Partners. In general, the general partners tend to trade at lower yields and have faster distribution growth. Currently, Enterprise GP Holdings' yield is below 5%. But with that one you're looking at low double-digit distribution growth for probably for the next three to five years.
TER: What accounts for that faster distribution growth?
JE: What accounts for it is really the math associated with the way the incentive distribution rights work. The distribution rights are split between the Limited Partner (LP) unit holder and General Partner (GP) unit holder. The distribution rights typically start out with 2% going to the GP unit holder and 98% to the LP unit holder. Then there are certain benchmarks where it will trigger a change in the allocation, which is part of the partnership agreements.
Just for talking purposes, let's say you had a $1.00 distribution going to the LP unit holder at the point where you had a 98% / 2% distribution split. So $0.98 of distribution payout would go the LP unit holder, $0.02 to the GP unit holder. Then let's say the distribution payout hits $1.20. Typically, the splits will change to 85% to the LP unit holder and 15% to the GP unit holder. At $1.20, if you have a 15% payout to the GP unit holder instead of $0.02, you're going to be closer to $0.20. You can see that's very fast growth.
Then let's say the next threshold where you change the splits is a distribution payout of $1.50. There it changes to 75% / 25%. You'd have about $0.50 going to the GP unit holder. Again, a very fast growth rate. Then if you move up to the next threshold, like around $2.00, it might be a 50% / 50% split, with $1.00 going to the LP unit holder and $1.00 to the GP unit holder. With a GP you start from a lower base, but you end up growing the incentives much faster. They typically trade at a lower yield but you can often get a very strong return by being able to participate as an investor in the opportunity to access those stronger distribution growth rates. The flip side is that if the LP has to hold or slow down the growth in distributions, then you see a much greater rate of change reflected at the GP level. Hence the higher growth rates and lower yields are accompanied by greater risk.
TER: They are also MLP funds. Could you provide a brief description of the differences between an open-end fund and a closed-end fund for our readers?
JE: A closed-end fund can trade at a price that's different than the underlying net asset value. Typically, open-end funds will trade in line with their underlying net asset value. Open-end funds in effect are mark to market, if you will, with their underlying asset. A closed-end fund doesn't have to. It can trade at a discount or premium to what its underlying holdings are worth. That's the fundamental difference.
TER: And do you have an opinion about investing in one or the other?
JE: There are a lot of funds out there. I think there are a lot of good funds out there. It's just a way for investors to perhaps participate in the sector through a diversified approach as opposed to perhaps building a portfolio of MLPs, which is what we recommend.
TER: Do you have any thoughts on the MLP sector that you would like to leave us with?
JE: We still think that MLPs, particularly for the long term, offer a compelling opportunity for investors. With the bounce back off the lows, our outlook for the rest of 2010 is attractive. We're thinking somewhere in the 7% to 13% range in terms of total return. Given that the sector is up and has delivered returns in the 15%–18% (as of July 9) range so far this year, we think that's pretty good. We think it's something investors should continue to consider for their portfolios.
John Edwards, CFA, joined Morgan Keegan in October 2006 as a vice president, covering energy infrastructure master limited partnerships. Prior to joining Morgan Keegan, Edwards was a managing partner of Vektor Investment Group, LLC, where he consulted on energy infrastructure projects and real estate development. Edwards also worked with Deutsche Bank Securities as a vice president and senior analyst covering natural gas pipelines and as an associate analyst covering automotive suppliers. Edwards began his career in the energy industry with Edison International where he worked in regulatory finance, M&A, project finance and business development. He received his BA from Occidental College in Los Angeles, California, and an MBA from California State University, Fullerton. He is also a member of the Financial Analysts Society of Houston, Tex.
Learn more about MLPs. Read Michael Blum: ABCs of MLPs and visit The Energy Report's MLP Directory.
Want to read more exclusive Energy Report interviews like this? Sign up for our free e-newsletter, and you'll learn when new articles have been published. To see a list of recent interviews with industry analysts and commentators, visit our Expert Insights page.
DISCLOSURE:
1) Brian Sylvester and Karen Roche of The Energy Report conducted this interview. They personally and/or their families own shares of the companies mentioned in this interview: None.
2) The following companies mentioned in the interview are sponsors of The Energy Report: None.
3) Greg Gordon: See Morgan Stanley disclosure that follows.*
*The information and opinions in Morgan Stanley Research were prepared by Morgan Stanley & Co. Incorporated, and/or Morgan Stanley C.T.V.M. S.A. As used in this disclosure section, "Morgan Stanley" includes Morgan Stanley & Co. Incorporated, Morgan Stanley C.T.V.M. S.A. and their affiliates as necessary.
For important disclosures, stock price charts and equity rating histories regarding companies that are the subject of this report, please see the Morgan Stanley Research Disclosure Website at www.morganstanley.com/researchdisclosures, or contact your investment representative or Morgan Stanley Research at 1585 Broadway, (Attention: Research Management), New York, NY, 10036 USA.
The ENERGY Report is Copyright © 2009 by Streetwise Inc. All rights are reserved. Streetwise Inc. hereby grants an unrestricted license to use or disseminate this copyrighted material only in whole (and always including this disclaimer), but never in part. The ENERGY Report does not render investment advice and does not endorse or recommend the business, products, services or securities of any company mentioned in this report. From time to time, Streetwise Inc. directors, officers, employees or members of their families, as well as persons interviewed for articles on the site, may have a long or short position in securities mentioned and may make purchases and/or sales of those securities in the open market or otherwise.
© 2005-2022 http://www.MarketOracle.co.uk - The Market Oracle is a FREE Daily Financial Markets Analysis & Forecasting online publication.