U.S. Housing Market, Worst Behind Us Or Another Downleg?
Housing-Market / US Housing Dec 05, 2009 - 12:48 PM GMTBy: Tim_Wood
 This past spring and summer there was a surge in real estate activities. The consensus amongst the realtors and builders that I talk to are of the opinion that the worst is behind us. However, the charts say we are now seeing another housing slow down.
I was able to successfully call the housing top using my methods of cyclical analysis. The first of a series of articles on this topic was published here in the October 28th 2005 Wrap Up, in which I gave the parameters that would confirm a major top had occurred. I also did follow up articles in early 2006 as the topping process unfolded. The week of May 26th 2006 we saw cyclical confirmation that a major top had occurred and by July 2006 the pain was beginning to be felt.
I specifically remember talking to builders and developers in early 2007 and they were confident that the weakness into 2006 was just a temporary phenomenon. But, the cycles held true and it proved to be that this was a major top and not just a temporary slowdown.
By mid 2007 the reality of the situation began to set in and by early 2009 the wrath of the real estate bubble was widespread. I know of houses that sold earlier this year for 60 cents on the dollar from what they had previously sold for just a few years earlier. Many builders in my area have been forced out of business. There are still abandoned developments and the foreclosures continue. I know first hand of cases in which people have walked away from their homes because they owed more on the property than it was worth. In a recent conversation with a realtor that works foreclosures he explained that in January he was seeing foreclosures selling below asking price. Now, he is seeing foreclosures selling above asking price.
What has happened is that prices have reached enough of a low to spark speculative buying. Because of the deep discounted price compared to just a couple of years ago, people are coming in and picking up what is now perceived as deals. As a result, we saw a pick up in real estate this past spring and summer. In my area we have even begun to see some new building. But, I believe that pick up was likely a bear market rally if you will. I still know of cases in which people are walking away from their homes. Just as the charts and cycles were used to identify the top, I can now use the charts to help monitor the current developments and assess the health and vitality of the pick up seen earlier this year.
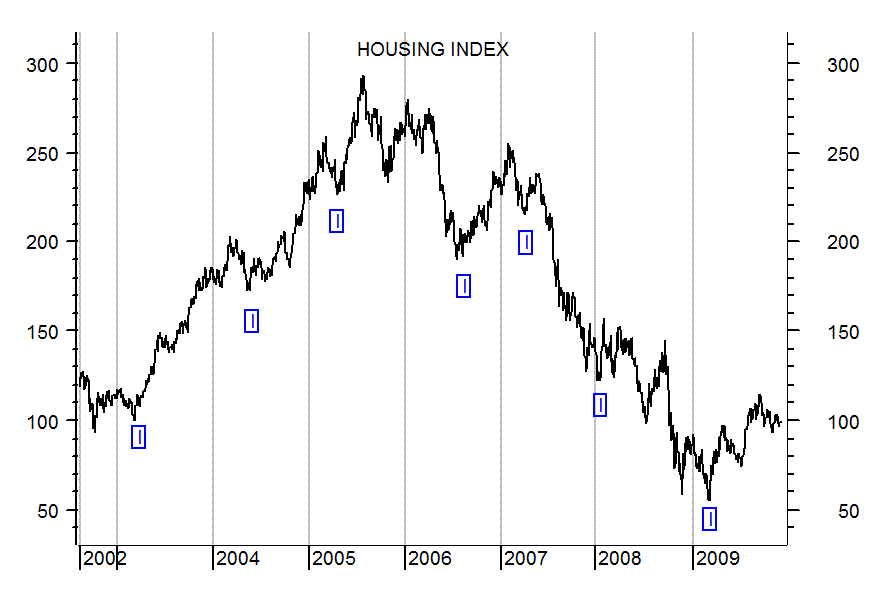
In the first chart below is the Philadelphia Housing Index. It is the ebb and flow of the intermediate-term cycle, which I have noted with an “I”, that is important. Note that as the housing boom unfolded, this cycle progressively made higher highs and higher lows. It was then in early 2006 when price broke below the 2005 intermediate-term cycle low that served as a warning that longer-term cycles had peaked and that THE top had been seen. As you can see in the chart below, price advanced this past spring and summer out of the most recent intermediate-term cycle low.
However, my indicators now tell me that this cycle has likely topped. The key will be how the decline into the next intermediate-term cycle low unfolds. My suspicion is that we will see the intermediate-term cycle depress prices into early 2010, but that price will hold above the previous intermediate-term cycle low. Then, once the next cycle begins to advance, optimism will again return the real estate market.
We will see another spurt in sales and building as price moves up out of the intermediate-term cycle low in early 2010. It will then be that next intermediate-term cyclical advance that will be of key importance and that will put the Housing Index, and consequently the housing market, at risk of a setup for another leg down to begin. We will have more data to assess this situation with once the intermediate-term cycle low in early 2010 is made.

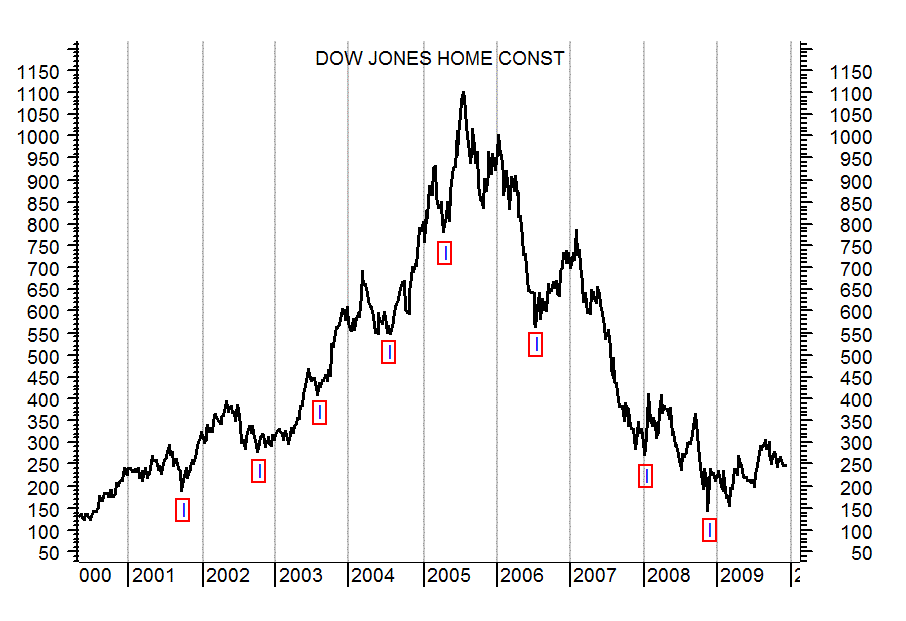
Next I have included a chart of the Dow Jones Home Construction Index. Here too, I have marked the intermediate-term cycle lows with an “I”. Here too, we have seen a bounce out of the low that was made earlier this year. Based on my Cycle Turn Indicator, which is not pictured here, the intermediate-term advance has most likely run its course and the technical outlook here is pretty much the same as with the Housing Index.
The bottom line is that we should expect further weakness in this sector into early 2010. It will be the developments that follow in the wake of this weakness that will be key in determining whether or not housing has made a longer-term lasting low, or if this was all just a flash in the pan. Given the still fragile state of the economy, the ongoing credit crisis, continued stream of foreclosures, business failures, bankruptcies, etc, it is far too early to say that the real estate market has made a lasting low. Just as the charts were used to identify the top, they can be used to identify the bottom and at this time we do not, in my opinion, have sufficient data to say that housing has bottomed and with the fundamentals as bleak as they are I would argue that the data there is pretty much the same.

I have begun doing free Friday market commentary that is available at www.cyclesman.info/Articles.htm so please begin joining me there. The specifics on Dow theory, my statistics, model expectations, and timing are available through a subscription to Cycles News & Views and the short-term updates. I have gone back to the inception of the Dow Jones Industrial Average in 1896 and identified the common traits associated with all major market tops. Thus, I know with a high degree of probability what this bear market rally top will look like and how to identify it. These details are covered in the monthly research letters as it unfolds. I also provide important turn point analysis using the unique Cycle Turn Indicator on the stock market, the dollar, bonds, gold, silver, oil, gasoline, the XAU and more. A subscription includes access to the monthly issues of Cycles News & Views covering the Dow theory, and very detailed statistical based analysis plus updates 3 times a week.
By Tim Wood
Cyclesman.com
© 2009 Cycles News & Views; All Rights Reserved
Tim Wood specialises in Dow Theory and Cycles Analysis - Should you be interested in analysis that provides intermediate-term turn points utilizing the Cycle Turn Indicator as well as coverage on the Dow theory, other price quantification methods and all the statistical data surrounding the 4-year cycle, then please visit www.cyclesman.com for more details. A subscription includes access to the monthly issues of Cycles News & Views covering the stock market, the dollar, bonds and gold. I also cover other areas of interest at important turn points such as gasoline, oil, silver, the XAU and recently I have even covered corn. I also provide updates 3 times a week plus additional weekend updates on the Cycle Turn Indicator on most all areas of concern. I also give specific expectations for turn points of the short, intermediate and longer-term cycles based on historical quantification.
Tim Wood Archive |
© 2005-2022 http://www.MarketOracle.co.uk - The Market Oracle is a FREE Daily Financial Markets Analysis & Forecasting online publication.


