


Stock Market Dumb Money Bullish Again!
Stock-Markets / Stocks Bear Market Aug 02, 2009 - 08:35 AM GMTBy: Guy_Lerner

 Over the last 4 weeks, the S&P500 has gained a little more than 12%, and during that time, investor sentiment, as measured by the "Dumb Money" indicator, was neutral. Prior to last month's huge run up, the "Dumb Money" indicator was in bullish territory (i.e., bear signal) for 10 consecutive weeks, and during that time the S&P500 lost 3.5%. This week (or rather after last month's monstrous surge), we find the bulls ready to buy high and sell higher again as the "Dumb Money" indicator has moved back into an extreme bullish reading.
The "Dumb Money" indicator is shown in figure 1. The "Dumb Money" indicator looks for extremes in the data from 4 different groups of investors who historically have been wrong on the market: 1) Investor Intelligence; 2) Market Vane; 3) American Association of Individual Investors; and 4) the put call ratio.
Figure 1. "Dumb Money" Indicator/ weekly
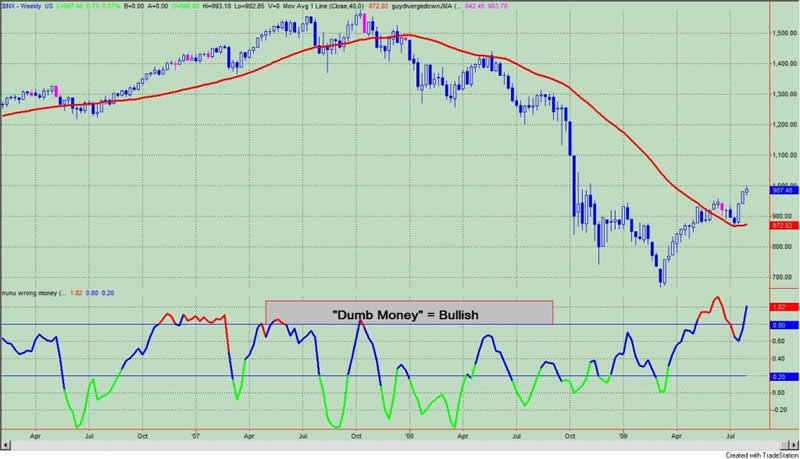
Typically, extremes in bullish sentiment are a bear signal unless this is a bull market circa 1995 or 2003. I still have my doubts. Even though the recession may end soon, a recovery seems to be a long ways off. The next 3 months of the year are generally poor ones for equities. Technically, we are all over the map. A close over the simple 10 month moving average is an encouraging sign no doubt, but an over bought, extremely exuberant market is not my "cup of tea". I would wait for a more risk adjusted entry point.
From a bigger picture standpoint, the market is playing out this week as I suggested last week:
As investors are not buying into the rally, one might conclude that the rally will march onward and upward until they do, and then it will rollover. That seems likely. (We are here now.) However, it is hard to imagine that prices will continue making gains at the pace seen over the past two weeks. (Last week's gain was the least in 3 weeks.) I still stand by the sell signal and expected spike in prices that I wrote about two weeks ago. (This is now three weeks ago.) The recent "breakout" in prices will eventually be seen as a better time to sell rather then a new launching pad for a bull market.
From my vantage point, much of the past 3 weeks the market has rallied on short covering. My evidence for this comes from the Rydex asset data. One of my favorite aspects of the Rydex data is the amount of assets in the bullish and leveraged funds versus the amount of assets in the leveraged and bearish funds. Not only do we get to see what direction these market timers think the market will go, but we also get to see how much conviction (i.e., leverage) they have in their beliefs. See figure 2 a daily graph of the S&P500 (symbol: $INX) with the Rydex leveraged bulls (green line) versus the leveraged bears (red line) in the lower panel. Typically, we want to bet against the Rydex market timer even though they only represent a small sample of the overall market.
Figure 2. Rydex Bullish and Leveraged v. Bearish and Leveraged/ daily
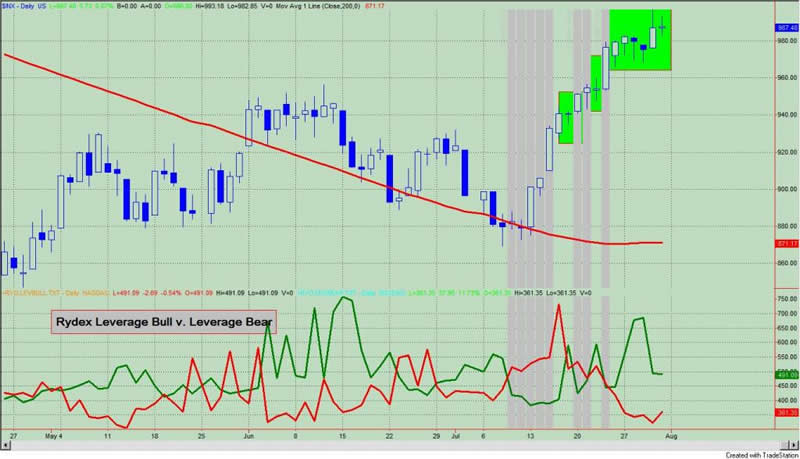
Since the low on July 8, there have been 17 trading days; there were 9 trading days in which the amount of bearish and leveraged assets was greater than the bullish and leveraged assets. In other words, our representative market sample (i.e., the Rydex market timers) were betting against the market. These days are identified with gray vertical lines in figure2. During these 9 trading days the S&P500 was up almost 11%!!! Not surprisingly durng the other 8 days when the bullish and leveraged assets exceeded the bearish and leveraged the market gained only 1.14%. These days are identified with the green boxes over the price bars.
So we have 9 tradings days of more bears and than bulls where the market gained 1.22% per day versus 8 trading days of more bulls than bears where the market gained 1.14% the entire time. This seems like short covering to me. This would also be consistent with our "this time is different" scenario. Short covering necessarily isn't a bad thing, and it is how most rallies are started any way. The flip side to higher markets on short covering is that buyers tend to evaporate with higher prices, and that appears to be the pattern since May, 2009. When the Rydex bullish and leveraged assets are greater than the bearish and leveraged assets there is no short covering to propel prices higher, and we see lower prices chasing the bulls back to the sidelines.
I don't doubt the power of the market or the power of the trend to humble this poor analyst, and I use the word "poor" in the figurative sense not literal!!! However, patience is important here as the market is over bought and as investor sentiment is bullish to an extreme. I am willing to be patient for that more risk adjusted entry.
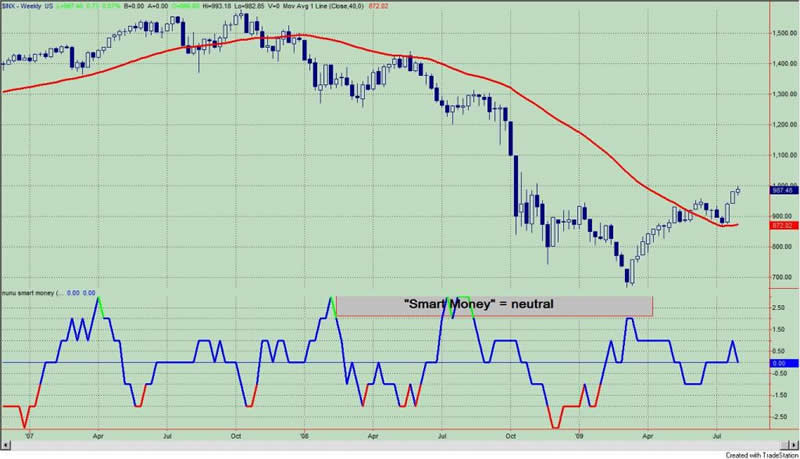
The "Smart Money" indicator is shown in figure 3. The "smart money" indicator is a composite of the following data: 1) public to specialist short ratio; 2) specialist short to total short ratio; 3) SP100 option traders. The "smart money" is neutral.
Figure 3. "Smart Money" Indicator/ weekly
Lastly, I am on holiday this week and the posting will be more infrequent than normal. Have a great week! Stay cool!!
By Guy Lerner
http://thetechnicaltakedotcom.blogspot.com/
Guy M. Lerner, MD is the founder of ARL Advisers, LLC and managing partner of ARL Investment Partners, L.P. Dr. Lerner utilizes a research driven approach to determine those factors which lead to sustainable moves in the markets. He has developed many proprietary tools and trading models in his quest to outperform. Over the past four years, Lerner has shared his innovative approach with the readers of RealMoney.com and TheStreet.com as a featured columnist. He has been a regular guest on the Money Man Radio Show, DEX-TV, routinely published in the some of the most widely-read financial publications and has been a marquee speaker at financial seminars around the world.
© 2009 Copyright Guy Lerner - All Rights Reserved
Disclaimer: The above is a matter of opinion provided for general information purposes only and is not intended as investment advice. Information and analysis above are derived from sources and utilising methods believed to be reliable, but we cannot accept responsibility for any losses you may incur as a result of this analysis. Individuals should consult with their personal financial advisors.
Guy Lerner Archive |
© 2005-2022 http://www.MarketOracle.co.uk - The Market Oracle is a FREE Daily Financial Markets Analysis & Forecasting online publication.
Comments
|
TraderJoe
05 Aug 09, 15:00 |
dumb money
your wrong Guy, its the dumb money thats been shortign this rally, |