U.S. House Prices Have Bottomed
Housing-Market / US Housing Jun 30, 2009 - 11:25 AM GMTBy: Uncommon_Wisdom
 Larry Edelson writes: I just arrived at my condo in Bangkok, Thailand — my home away from home — where I’ll be working out of for the next four or five months. Expect me to cover lots of ground as I report from the front lines about the myriad profit opportunities that are popping up in Asia.
I’ll also give you an update on the latest developments in U.S. stocks … the dollar … gold … and oil.
But first, a forecast that I want to put on the record: I believe U.S. real estate prices have bottomed and are on the mend.
Not many will agree with me. That’s for sure. And mind you, my forecast doesn’t mean property prices in every town in the United States have hit bottom.
Nor does it mean you should run out to blindly buy property and expect to get rich on it overnight.
But all the evidence I see tells me real estate prices in the U.S. are now a bargain … that we’re at the bottom … and that there will be a recovery in property prices, albeit slowly, over the next several years.
Amongst the evidence I see …
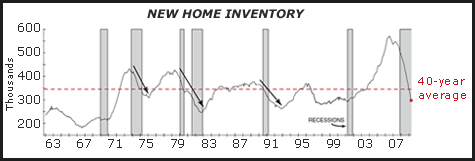
#1. New home inventories are now at previous recession lows. You can see it in this chart I have for you, courtesy of the U.S. Census Bureau data and compiled by James Stack at Investech Research.
Notice how the inventory of new homes has fallen well below its 40-year average, to levels that have marked previous recession lows in inventories.

This is not to say inventories of new homes can’t fall lower. But as inventories fall, so does the supply of new homes, which is generally bullish for prices.
Looked at another way, the bulk of the oversupply of new homes has largely been worked off.
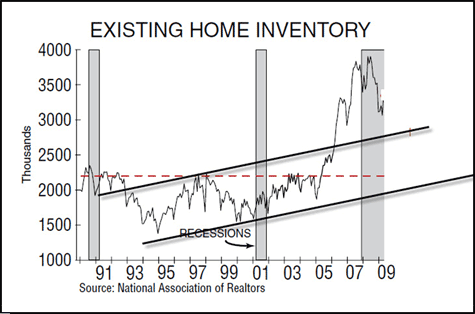
#2. Existing home inventories have also fallen sharply. Although they have not plunged as low as one might expect from looking at this chart, they have not only peaked, but they have fallen to an area that should find support, as you can see from the trend channel I’ve drawn for you.

Also note: Due to foreclosures, short sales, and other workouts going on in the real estate market, existing home inventory data is likely to lag the bottom in real estate prices.
#3. Anecdotal evidence points to a pickup in demand. The Pending Home Sales Index, a leading indicator and a measure of home sales that will go to contract within two months, has risen for four months straight. This includes sharp increases of as much as 32.6 percent in the Northeast.
Existing home sales have also been on the rise, increasing 6.2 percent since the start of the year. Meanwhile, the median sales price of existing homes has jumped almost 5 percent in the same period.
But perhaps most compelling …
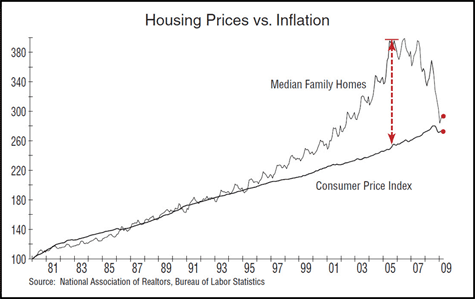
#4. Housing affordability has come back down to the CPI inflation trend line. I find this chart especially interesting. Courtesy of Investech Research, it’s a picture of housing prices vs. inflation as defined by the (conservative) Consumer Price Index since 1980.
You can clearly see the housing bubble in this chart, as home prices vastly exceeded the CPI inflation rate starting in 1997, and exploded higher into Bubbleland, bursting in 2007.

Notice how the median family home price has collapsed back to the growth rate of inflation, per the CPI. Put another way, the median home price is back to inflation-adjusted levels, with the majority of the price deflation behind us.
What’s more, the National Association of Realtor’s Housing Affordability Index is now in record territory, indicating that housing prices are now more affordable than they’ve been since this index was created in 1970.
#5. On an international basis, U.S. property prices are cheaper than they’ve been in at least 10 years.
Consider the following: The U.S. median home price has fallen 21.3 percent — more than $56,000 — since its peak at $262,600 in March 2007.
In terms of the international purchasing power of the dollar, which has declined precipitously, the median price of a single-family home has fallen more than 35 percent to levels last seen in 1998.
That’s due to the decline in the international purchasing power of the dollar since 2001, coupled with the decline in housing prices in dollar terms.
Note: The decline in the value of the dollar will become an important stabilizing factor in U.S. real estate prices. It means more foreign investors should soon be investing in U.S. property, bolstering demand and even pushing up prices.
Indeed, based on my travels, particularly through Asia, and considering especially metropolitan areas and their suburbs in places such as Hong Kong, Singapore, Shanghai and even Bangkok — I would say that U.S. property prices now represent some of the best bargains on the planet.
What about interest rates? Right now, they’re historically low and a boon to the property market in the United States.
But here’s a little unconventional wisdom: Don’t expect any rise in mortgage rates to kill off a recovery in U.S. property prices.
Quite to the contrary, I would consider rising long-term interest rates bullish for U.S. property prices. Chief reason: Rising interest rates will likely set off a stampede of potential buyers and investors to get into real estate — before rates head higher.
Indeed, historically the biggest bull markets in real estate have occurred in conjunction with rising mortgage rates, not declining rates.
To play the recovery in property prices …
I would consider the ProShares Ultra Real Estate ETF (URE), which tracks twice (200 percent) the daily performance of the Dow Jones U.S. Real Estate Index.
Though leveraged and not a pure real estate play in the sense that it also includes commercial Real Estate Investment Trusts (REITS) in its holdings, I believe it’s one of the better ways to play a turnaround in property prices.
But use discretion, since it’s leveraged at two times the underlying index. I would risk no more than 5 percent of your investment.
Now, on to what I’m seeing in the markets …
All markets — the Dow, gold, oil, the dollar — are currently taking a breather from their intermediate-term trends, which remain …
![]() Up for the Dow, with my projection of Dow 9,000 to 10,000 still on track
Up for the Dow, with my projection of Dow 9,000 to 10,000 still on track
![]() Up for gold, which should see a new leg up once a test of support at the $900 to $925 level is complete
Up for gold, which should see a new leg up once a test of support at the $900 to $925 level is complete
![]() Down for the dollar
Down for the dollar
![]() Down for bonds, and up for longer-term interest rates
Down for bonds, and up for longer-term interest rates
![]() Up for Asian stock markets
Up for Asian stock markets
In other words, all trends that I’ve been discussing recently remain on track. So hold any positions that I’ve suggested in this column!
Best wishes,
Larry
P.S. Be sure to take out subscription to my Real Wealth Report, which has nailed almost all of the major trends unfolding so far this year. And where you’ll get the inside scoop on China, still the world’s strongest economy, in the very next issue, which publishes on Friday, July 17.
A subscription to Real Wealth Report is just $99 a year, the best money you’ll ever spend on your investments.
This investment news is brought to you by Uncommon Wisdom. Uncommon Wisdom is a free daily investment newsletter from Weiss Research analysts offering the latest investing news and financial insights for the stock market, precious metals, natural resources, Asian and South American markets. From time to time, the authors of Uncommon Wisdom also cover other topics they feel can contribute to making you healthy, wealthy and wise. To view archives or subscribe, visit http://www.uncommonwisdomdaily.com.
Uncommon Wisdom Archive |
© 2005-2022 http://www.MarketOracle.co.uk - The Market Oracle is a FREE Daily Financial Markets Analysis & Forecasting online publication.


