


Has the Stocks Bear Market Bottomed?
Stock-Markets / Stocks Bear Market Apr 09, 2009 - 07:39 PM GMTBy: Hans_Wagner

 After a long and brutal bear market, investors naturally wonder with each bear market rally whether we have reached a stock market bottom yet. Many analysts do not believe you can tell when the stock market has bottomed. Yet you still see many predictions that the market has bottomed out. Identifying whether we have reached a bottom in the stock market is important to investors who want to beat the market. It is also important to know whether we have reached a bottom in the stock market, so you can reduce your risk of entering to soon. This article provides two methods that you might find useful in identifying when the stock market has bottomed out.
Monthly S&P 500 View
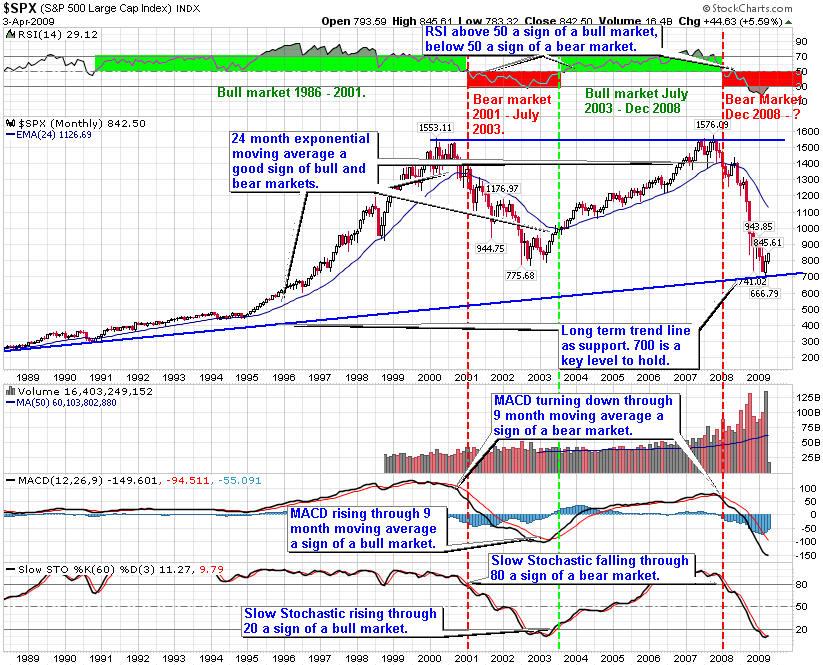
Many of you who have been reading these articles will find this method familiar. Using the monthly chart of the S&P 500, take the 24-month exponential moving average and three other indicators to provide confirmation of bear and bull markets. While it will not get you into the market at the bottom of the stock market, it will keep you from over committing to early during a bear market rally, yet allowing you to enjoy the bulk of the new bull market.
As noted below for the bull market that begins in 2003 when the S&P 500 rises through the 24 month EMA, it was a sign of a new bull market. In addition, when the RSI rises through 50, it is another sign of a new bear market. When MACD rises through the 9-month moving average, it will be another sign the bear market is over. The Slow Stochastic needs to rise through 20 to give another indication a new bull market is beginning.
In reviewing the current period of the chart, it will take several months before the monthly S&P 500 approaches the 24-month EMA. The same holds for the RSI, MACD, and Slow Stochastic indicators. This is telling us the stock market has not bottomed yet and the stock market will remain in a bear market for a while longer.
150 Day Exponential Moving Average
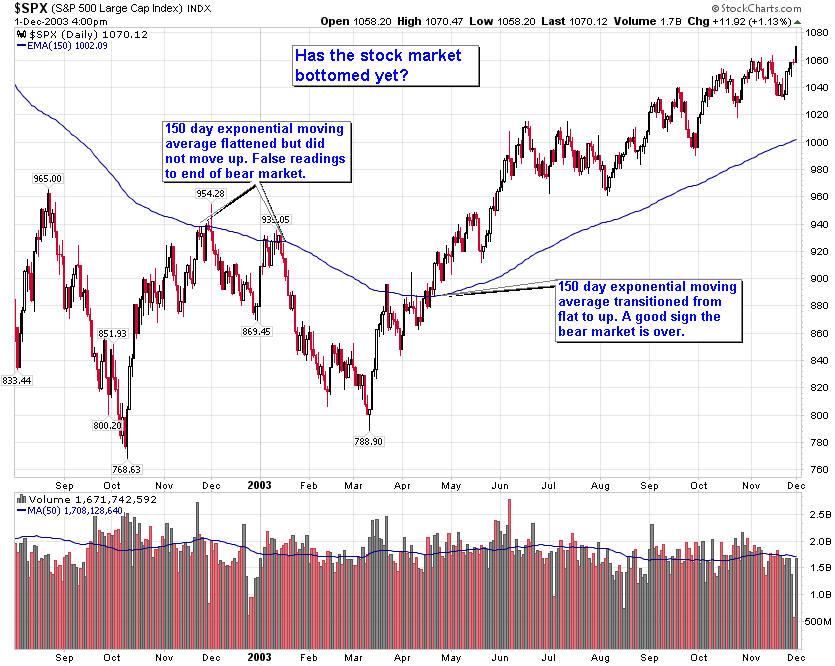
The 150-day Exponential Moving Average (EMA) seems to be useful at telling us when the bear market is over. When the 150-day EMA transitions from moving down, flattens, and then moves up, it is a sign the stock market has bottomed and a new bull market has begun. The chart below shows the transition from a bear to bull market that took place in late 2002 and early 2003. The 150-day EMA flattened once in November 2002 and then again in January 2003, as the result of bear market rallies. In each case the 150-day EMA only flattened, it did not turn up, meaning the stock market had not yet bottomed.
In April 2003, the 150-day EMA flattened once again and then turned up. This meant the stock market had finally bottomed and a new bull market had begun. In this case, the 150-day EMA signal came two months earlier than the signal given by the monthly view in the chart of the S&P 500 above.
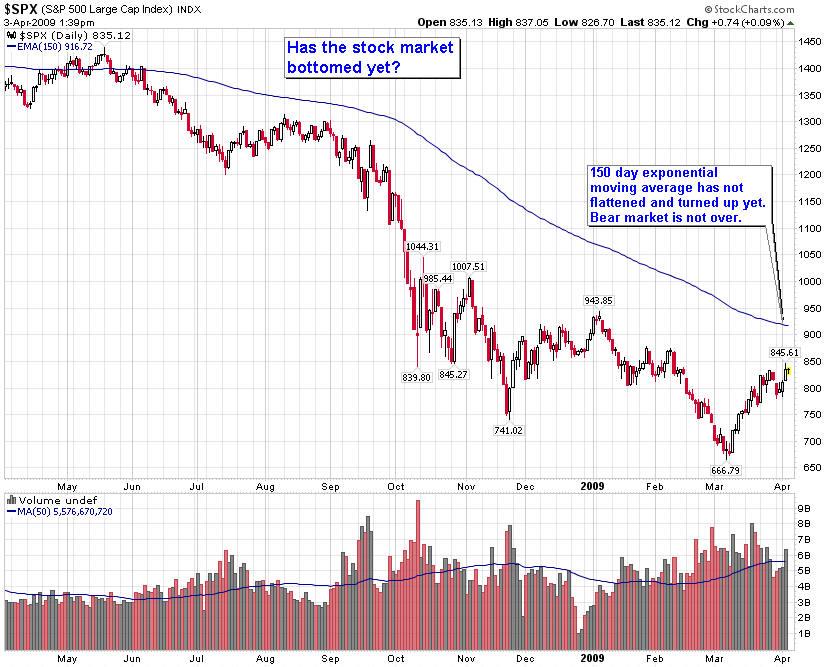
This raises the question, has the current stock market bottomed yet? As of April 3, 2009, the 150-day Exponential Moving Average had not flattened let along turn up. This tells us the current rally is not a stock market bottom yet. Most likely, this bear market rally will end before the 150-day EMA turns up.
For investors this means they need to enjoy the current rally for as long as it lasts. However, they should also be ready to reduce their exposure to long positions once the rally ends, since the stock market has not yet bottomed.
By the way, the 150-day Exponential Moving Average also works well for other indexes as well as market sectors.
Stock Market Bottom, Not Yet.
Calling the bottom of the stock market is a game played by many investors. Investors do not want to be left out, once the bear market is over and the stock market bottom is in place. The problem is the market tends to shake out investors with bear market rallies that hold promise, but then fail. Often these bear market rallies shake out most of the remaining believes in the market. Once the stock market has finally bottomed out, it rallies once again. Only this time it is the start of a new up trend as predicated by the indicators mentioned.
Has the stock market bottomed yet? No, not yet. Once we receive the signals described here, we will know the stock market bottom is in and a new bull market is underway. Until then we remain in a bear market.
By Hans Wagner
tradingonlinemarkets.com
My Name is Hans Wagner and as a long time investor, I was fortunate to retire at 55. I believe you can employ simple investment principles to find and evaluate companies before committing one's hard earned money. Recently, after my children and their friends graduated from college, I found my self helping them to learn about the stock market and investing in stocks. As a result I created a website that provides a growing set of information on many investing topics along with sample portfolios that consistently beat the market at http://www.tradingonlinemarkets.com/
Copyright © 2009 Hans Wagner
Hans Wagner Archive |
© 2005-2022 http://www.MarketOracle.co.uk - The Market Oracle is a FREE Daily Financial Markets Analysis & Forecasting online publication.