


Sustainable Stocks Bull Market Not Likely
Stock-Markets / Stocks Bear Market Apr 08, 2009 - 07:35 AM GMTBy: Chris_Ciovacco

 Rather than relying on hope as the primary driver for making decisions, investors would be well served to focus on the fundamental and technical facts. An analysis of the facts leads us to conclude we are facing the following in terms of probable outcomes:
- Highest Probability – New lows / continuation of bear market.
- Moderate Probability – Cyclical bull – higher highs – followed by retests or new lows.
- Lowest Probability – A sustainable bull market (secular).
Fundamentals Remain Weak: From November 1929 to July 1932, there were five rallies in stocks between 20% and 23%, and all were followed by lower lows. In the 2007-2009 bear market, banks have been the area of primary concern. Banks remain a concern. While many market participants dismiss unemployment figures as lagging indicators, they fail to recognize that every time unemployment ticks up, default rates on all types of loans are going to tick up as well. The government has spent quite a bit of time and energy focusing on toxic assets in order to protect bank bondholders. The government's programs will have a muted effect as long as housing prices continue to fall and unemployment continues to rise. The inventory of homes for sale remains very high. Home prices have further to fall until supply and demand come back into balance. As prices fall, the balance sheets of banks will continue to deteriorate. It is widely accepted that unemployment will rise further, which means default rates on loans will also continue to climb.
Recession Related Problems Still To Come: The government's vast market intervention will do little to stem the tide of rising credit card and commercial real estate defaults. Banks have received significant government assistance with toxic assets, but they have major problems with more typical recession related issues, such as credit cards and commercial real estate defaults. Below are some excerpts from recent Bloomberg stories S&P 500 Can't See Enough Money to Feed Stocks' Rally and Mayo Gives Banks ‘Underweight' Rating on Loan Losses .
- Wall Street analysts overestimated bank profits for at least six consecutive quarters.
- Commercial property loans in default or foreclosure jumped 43 percent in the first quarter as the contraction reduced occupancies and the credit crisis stymied refinancing. The decline may force banks to increase loan-loss provisions and write down the value of commercial property loans, which Citigroup, Bank of America and JPMorgan are all carrying at 100 percent of face value, according to estimates in a March 24 report by Richard Ramsden, an analyst at New York- based Goldman Sachs Group Inc.
- CLSA analyst Mike Mayo assigned an "underweight" rating to U.S. banks, saying loan losses may exceed Great Depression levels and the government may be forced to take over large lenders.
- "While certain mortgage problems are farther along, other areas are likely to accelerate, reflecting a rolling recession by asset class," said Mayo, who joined CLSA from Deutsche Bank AG last month. "New government actions might not help as much as expected, especially given that loans have been marked down to only 98 cents on the dollar, on average."
- Mayo said he expects loan losses to increase to 3.5 percent, and as high as 5.5 percent in a stress scenario, by the end of 2010. The highest level of loan losses in the Great Depression was 3.4 percent in 1934, according to the report [by Mayo].
- The nation's largest banks may be transitioning from a financial crisis marked by writedowns of capital to an economic crisis featuring large loan losses, Mayo wrote. The U.S. government cannot provide much relief because its actions will lead to either banks having to raise new capital or toxic assets remaining on banks' balance sheets, Mayo wrote.
- Mayo said solutions to the banking crisis will take time, as the increase in risk happened over a decade or more.
- Meredith Whitney, who left Oppenheimer & Co. in February to found Meredith Whitney Advisory Group LLC, said in a Forbes interview that banks will continue to write down their mortgage assets as home prices decline further than lenders expected. Home prices are not done falling and will ultimately drop 50 percent from their peak, Whitney said today in a CNBC interview.
- The unemployment rate also has exceeded banks' projections and could lead to further loan losses, Whitney told Forbes. Banks “by and large” will show profits in the first quarter before provisions for loan losses, Whitney said on CNBC. (Source: Bloomberg.com ).
Earnings Are Still A Problem: The S&P 500 is currently trading at 14x forward earnings. Forward earnings are another way of saying estimated earnings. If you have worked on Wall Street for more than a week, you know estimates of future company earnings are extremely inaccurate, especially estimates made 12 months in advance. Earnings estimates are about as accurate as a local weather forecast made a year in advance. Since January 1, 2009, earnings estimates for the S&P 500 have dropped from $75 to $59 (a 34% decline in three months). The odds are extremely high that earnings estimates for the next 12 months will continue to be reduced significantly in the coming months, which means the S&P 500 is trading with a PE higher than 14. Bear markets can end with PEs in single digits.
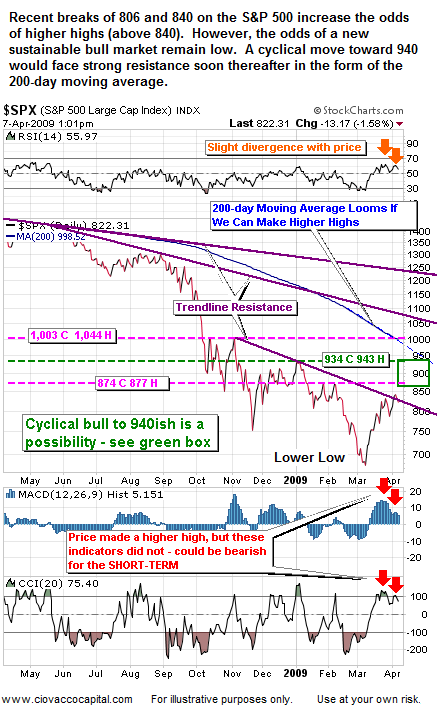
Recent Rally Impressive: The probability of a cyclical bull market taking shape has increased in recent weeks as investors have shown an increased appetite for risk in some markets. A cyclical bull market, in contrast to a secular bull market, is much shorter in duration and eventually gives way to the primary bearish trend. A cyclical bull market could see the S&P 500 advance as high as 940, which is 15% higher than current levels. Under the cyclical bull market scenario, stocks would take one of three paths after making higher highs (above 840):
- A correction back toward 840.
- A successful retest of the November 2008 or March 2009 lows (666-741).
- New bear market lows (below 666 on the S&P 500).
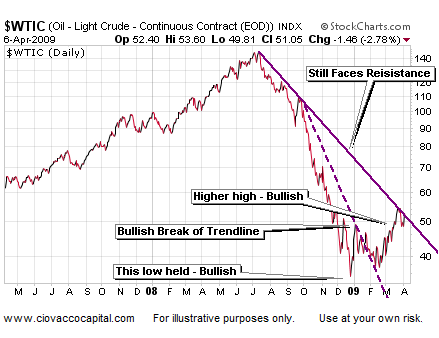
Some Positive Signs: Crude oil has shown some bullish signs by successfully testing a low, and then making an important higher high. Several markets, including some foreign stock markets and some commodity-related investments, have traced similar bullish paths in recent months. These are the markets we are focusing on at CCM as possible investment opportunities.
Some Concerns: The S&P 500 has not successfully tested a low, nor has it made an important higher-high. The odds are very high that before a new bull market can begin, the S&P 500 would have to successfully retest 741 or 666. This retest may come after higher highs, maybe as high as 940 on the S&P 500. The retest may occur during the current pullback or not for several months. Roughly 33% of the Dow 30 stocks have successfully tested a low, which leaves 67% most likely in need of a retest before a new bull market can start. Successful investors always focus on probabilities. Inexperienced investors are always looking for forecasts and predictions.
Some S&P 500 Levels To Watch: Support below the market may kick in at 813, 780, 770, 750, 730, and 700. Resistance above the market is at 836, 877, 885, and 944.
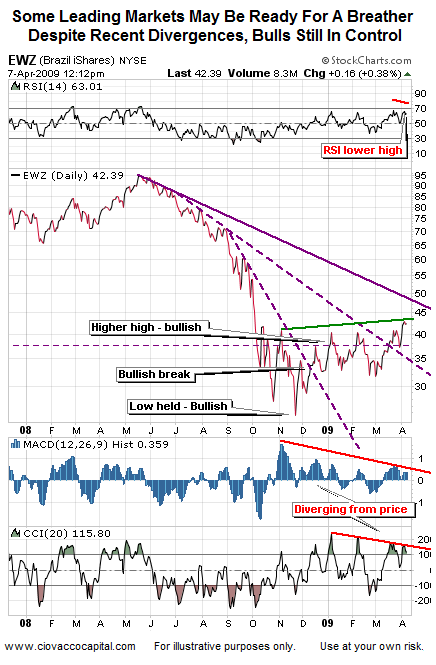
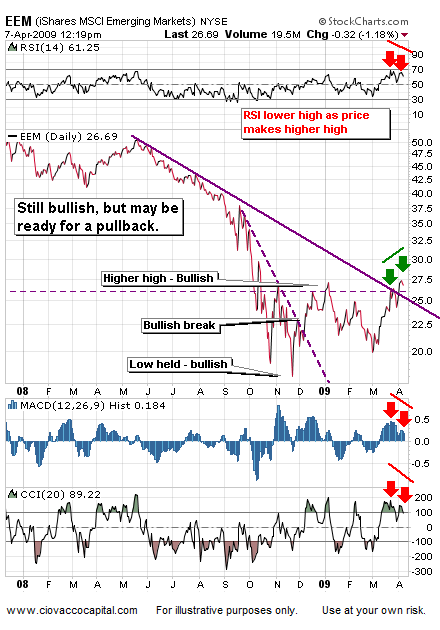
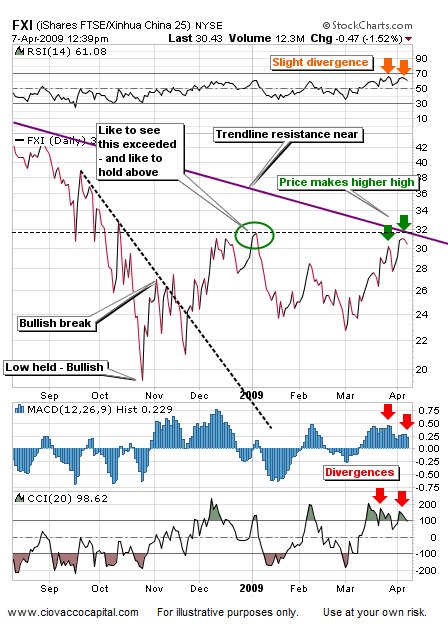
Leading Markets Show Signs Of Weakness: The markets shown below are some of the strongest markets in terms of technical strength. The technical strength tells us investors are more optimistic about these markets than they are about weaker markets such as the S&P 500. These markets may offer opportunities in the event we are in a new secular bull market or a cyclical bull market. While these markets all have some very positive characteristics, there are some technical yellow flags that we should not ignore.
Indicators Not Aligned With Price: In technical analysis, indicators should confirm moves in prices. For example when prices make a new high, we would like to see numerous technical indicators make a new high as well. When prices make a new high, but an indicator fails to make a new high, we have what is known as a negative divergence. A negative divergence can be an early signal that the bulls are losing some of their grip on the bears. Since March 23, 2009, we have seen numerous negative divergences in several leading markets. A single negative divergence in a single technical indicator is not all that concerning. However, the negative divergences become more significant when we see them in numerous indicators and across several markets. Below we present some negative divergences that may point to further corrections in risk assets. Since these divergences are shown on daily charts, they tell us to be cautious in the short-term. They do not necessarily send signals that these markets cannot advance after the current correction has run its course. Like all technical analysis, these divergences help us with probable outcomes – not certain outcomes. Once these divergences are cleared, positive divergences may appear which would be supportive of the cyclical or secular bull market outcomes. It is important to note these divergences appeared before markets started their current pullback.
S&P 500 Has Yet To Hold A Low: Our confidence level in the S&P 500 is not as great as markets that were able to hold above an important low and subsequently make a meaningful higher high. For those who missed it, we recently outlined some additional fundamental concerns in Stock Rally Built On Sand? .
The consensus seems to be for higher highs in stocks followed by a resumption of the bear market. While we can see this possibility, we also point out that few are acknowledging the possibility of new bear market lows. The consensus is rarely right in the financial markets. As a result, it is important to understand the big picture and observe with an open mind. If we do so, the markets will provide us with some meaningful insight into the state of the global economy.
The charts and commentary above are for illustrative and educational purposes only and are not recommendations to buy or sell any security.
By Chris Ciovacco
Ciovacco Capital Management
Copyright (C) 2009 Ciovacco Capital Management, LLC All Rights Reserved.
Chris Ciovacco is the Chief Investment Officer for Ciovacco Capital Management, LLC. More on the web at www.ciovaccocapital.com
Ciovacco Capital Management, LLC is an independent money management firm based in Atlanta, Georgia. As a registered investment advisor, CCM helps individual investors, large & small; achieve improved investment results via independent research and globally diversified investment portfolios. Since we are a fee-based firm, our only objective is to help you protect and grow your assets. Our long-term, theme-oriented, buy-and-hold approach allows for portfolio rebalancing from time to time to adjust to new opportunities or changing market conditions. When looking at money managers in Atlanta, take a hard look at CCM.
All material presented herein is believed to be reliable but we cannot attest to its accuracy. Investment recommendations may change and readers are urged to check with their investment counselors and tax advisors before making any investment decisions. Opinions expressed in these reports may change without prior notice. This memorandum is based on information available to the public. No representation is made that it is accurate or complete. This memorandum is not an offer to buy or sell or a solicitation of an offer to buy or sell the securities mentioned. The investments discussed or recommended in this report may be unsuitable for investors depending on their specific investment objectives and financial position. Past performance is not necessarily a guide to future performance. The price or value of the investments to which this report relates, either directly or indirectly, may fall or rise against the interest of investors. All prices and yields contained in this report are subject to change without notice. This information is based on hypothetical assumptions and is intended for illustrative purposes only. THERE ARE NO WARRANTIES, EXPRESSED OR IMPLIED, AS TO ACCURACY, COMPLETENESS, OR RESULTS OBTAINED FROM ANY INFORMATION CONTAINED IN THIS ARTICLE. PAST PERFORMANCE DOES NOT GUARANTEE FUTURE RESULTS.
Chris Ciovacco Archive |
© 2005-2022 http://www.MarketOracle.co.uk - The Market Oracle is a FREE Daily Financial Markets Analysis & Forecasting online publication.