


Global Stock Markets Extend Gains on Money Printing
Stock-Markets / Global Stock Markets Mar 29, 2009 - 06:35 AM GMT

 Following Fed Chairman Ben Bernanke's “money printing” announcement of last week, the action stayed on Capitol Hill with Treasury Secretary Timothy Geithner detailing his Public Private Investment Program (PPIP) as well the initial salvo on “new rules of the game” for the US's broken system of financial regulation.
The US Treasury on Monday morning announced its highly-anticipated Private Public Investment Program (PPIP), rekindling investors' hopes that the worst might be over for the beleaguered banking sector and the global economy is close to a bottom.
Up to $1.0 trillion will be spent in an attempt to support the balance sheets of financial institutions by removing toxic assets - mostly mortgage-backed securities. The Treasury plans to invest between $75 billion to $100 billion from its existing Troubled Asset Relief Program (TARP), and also to establish a separate initiative that will use the Fed's Term Asset-backed Securities Lending Facility (TALF) and Federal Deposit Insurance Corporation (FDIC) funding to finance the PPIP.
Source: About.com
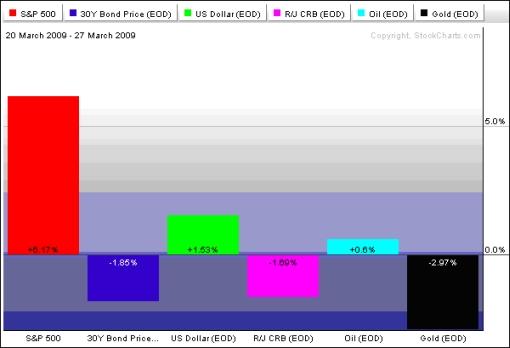
In reaction to the Obama administration's plan, global stock markets extended their gains and the US dollar reclaimed a stronger footing, but government bonds suffered from indigestion on issuance worries and the haven appeal of commodities waned. The performance of the major asset classes is summarized by the chart below, courtesy of StockCharts.com .
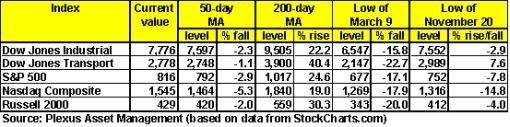
Stock markets, led by financials, surged on the unveiling of the Treasury's plan to deal with troubled assets, adding to the gains of the rally that commenced on March 10 (see table below). The Dow Jones Industrial Index moved up 497 points (+6.8%) on Monday, its fifth largest one-day point gain and 23 rd biggest one-day percentage gain on record.
Although stocks succumbed to profit-taking towards Friday's close, indices nevertheless managed to register a third straight week of gains - only the third time since the bear market began 78 weeks ago. With two trading days to go, March has the potential of producing the third best monthly return for the broad market since 1950.
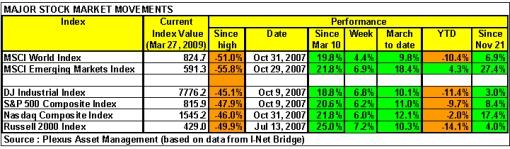
Elsewhere in the world stocks also performed strongly, with the MSCI World Index gaining 4.4% (YTD -10.4%) and the MSCI Emerging Markets Index ahead by 6.9% (YTD +4.3%). These indices have risen by 19.8% and 21.8% respectively since the low of March 9. Returns ranged from top-performers Peru (+17.4%), India (+12.6%) and Hong Kong (+10.0%) to Uganda (-5.7%), Côte d'Ivoire (-4.7%) and Bangladesh (-4.4%), which are still languishing in the red.
The Shanghai Composite Index (+3.9%) had another good week and remains at the top of the field for the year to date with a 30.1% gain in US dollar terms. (Click here to access a complete list of global stock market movements, in local currency terms, as supplied by Emeginvest .)
Emerging markets are showing mature markets a clean pair of heels, as can be seen from the rising trend line of the MSCI Emerging Markets Index relative to the Dow Jones World Index since late October. The fact that developing countries are now outperforming the developed ones is a sign that global investors are beginning to take more risk - a necessary ingredient for stock markets in general to improve further.
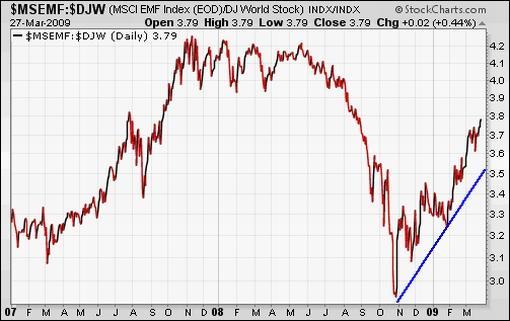
Source: StockCharts.com
As far as US exchange-traded funds (ETFs) are concerned, John Nyaradi ( Wall Street Sector Selector ) reports that the strongest funds this week were Claymore/MAC Global Solar Energy (TAN) (+32.1%), Market Vectors Solar Energy (KWT) (+25.8%) and iShares Dow Jones US Home Construction (ITB) (+20.8%). On the other end of the performance scale United States Natural Gas (UNG) (-12.6%), PowerShares DB Agriculture Fund (DBA) (‑4.6%) and iShares Silver Trust (SLV) (-3.4%) performed poorly.
Among the ten US economic groups, the Financial Select Sector SPDR (XLF) (+12.3%) led the way, with defensive funds such as Health Care Select Sector SPDR (XLV) (+3.0) and Utilities Select Sector SPDR (XLU) (+1.8%) falling behind, as one would expect in a rising market.
In the coming week, as reported by the New York Times , the US administration is likely to extend more short-term aid to General Motors and Chrysler, but impose a strict deadline for bondholders and union workers to make concessions that would help the ailing automakers become viable businesses and avert bankruptcy.
Also on the agenda next week, is the summit of the Group of 20 in London - a “make or break event”, according to George Soros (via Reuters ). In addition to the one-time increase of the IMF's resources, there ought to be substantial annual special drawing rights (SDR) issues, say $250 billion, as long as the global recession lasts, he said. SDRs are an international reserve asset created by the IMF in 1969 that has the potential to act as a super-sovereign reserve currency.
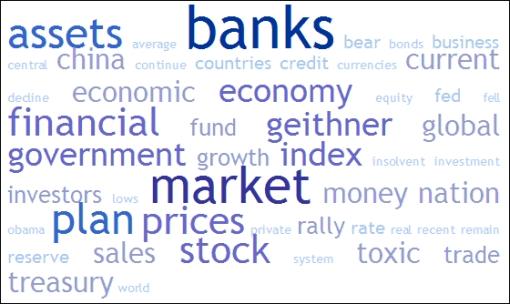
Next, a quick textual analysis of my week's reading. No surprises here with key words such as “banks”, “market”, “assets” and “plan” featuring prominently.
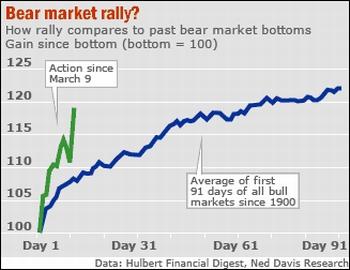
The nagging question remains: is the stock market rally for real, or is it just an upward correction in a bigger bear market? The worrying aspect is the rapidity with which the price increases have occurred. To gauge just how “violent” it has been, Mark Hulbert ( MarketWatch ) compared the rally since the March 9 lows to a composite of the stock market's behavior over the first two weeks of all bull markets since 1900. The graph below indicates that the market is perhaps in need of catching its breath.
Regarding specific “targets”, Adam Hewison of INO.com prepared a short technical analysis presentation dealing with key levels. Click here to view the clip. As shown in the table below, the 50-day moving averages have been cleared for all the major US indices and the early January highs (not shown) are the next targets. On the downside, the levels from where the nascent rally commenced on March 9 should hold in order for the upward trend to endure.
Kevin Lane, technical analyst of Fusion IQ , said: “We think the S&P 500 can still rally up to the 850-860 in the near term on the heels of the unwinding of the deeply oversold conditions, the large piles of sideline liquidity, and additional money managers are allocating to stocks so as not fall too far behind their benchmarks. At the aforementioned S&P 500 level some more aggressive profit-taking is likely to ensue and it may be a good time to take some chips off the table (i.e. lock in some profits). We would then look to reallocate on the next aggressive pullback.”
The graph below shows the percentage of S&P 500 stocks trading above their 50-day moving averages. Altogether 66% of the stocks are currently trading above their 50-day lines. This is getting close to the 80% (overbought) level seen at prior peaks during this bear market.
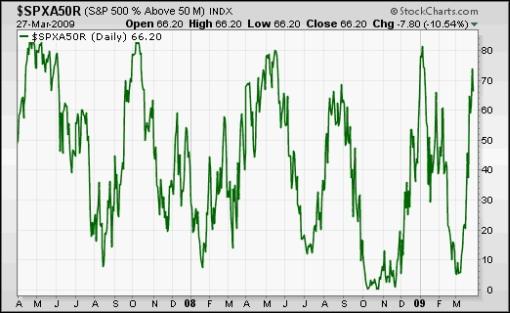
Source: StockCharts.com
Short-term movements aside, more bulls are coming to the fore by the day. According to Bloomberg , Mark Mobius, executive chairman of Templeton Asset Management, said the next bull market rally has begun. Also, Barton Biggs, the former chief global strategist for Morgan Stanley who now runs New York-based hedge fund Traxis Partners, last week predicted the S&P 500 may jump by 30%-50%. Similarly, Jeff Saut, strategist at Raymond James, argued that the “odds are pretty good stocks have seen their lows”.
From across the pond, London-based David Fuller ( Fullermoney ) said: “I feel that it is a defining rally …. increasing evidence that the bear market mostly ended last November. However, while Wall Street is the big elephant in the room, casting a large shadow in terms of influence, it is certainly not the leader. Fullermoney themes, led by Asian emerging markets and South American resources markets, definitely bottomed out in October and November. Many have also gone on to complete base formations.
“In the short-term, stock markets are technically overbought so we can expect a pause and consolidation. However, if the S&P 500 Index can hold onto approximately half of its gains from this month's lows, this would provide further evidence of recovery potential for the medium to longer term.”
On the other hand, Richard Russell ( Dow Theory Letters ), who has been studying markets since the 1950s, remains bearish: “The most helpful insights I've received during the course of this bear market are the Lowry's statistics and comments. From the latest Lowry's statistics I can see that although the Buying Power Index (demand) has risen sharply, the Selling Pressure Index (supply) has given ground rather grudgingly. Normally, if we were at the start of a new bull market, Selling Pressure should be collapsing. It is not.
“The conclusion is that there remains a surprising amount of Selling Pressure (supply) for this bear market advance to wade through. This is typical bear market rally action. Normally, prior to the start of a new bull market there will be an extended period in which the Selling Pressure Index slumps, indicating that sellers have exhausted their desire to sell. The inference is that we are experiencing a purely technical situation …”
One of the great concerns for the stock market rally is that the credit markets, the target of the rescue operations, are still far from “normal”. This was again seen during the past week when the US 30-day Treasury Bills dipped below zero on Thursday.
I believe stock markets are in a bottoming phase, but that this may take a while to play out. This is not a juncture at which one should go all-out bullish or bearish. Taking one step at a time, the next hurdle is the release of potentially ugly earnings and guidance announcements in April. By then a clearer picture should also start emerging on the results of the Fed's medicine and whether credit markets are thawing and confidence is beginning to improve.
For more discussion about the direction of stock markets, also see my recent posts “ Video-o-rama: Risk appetite rekindled on hope of better days “, “ Stock markets: Keep an eye on confidence measures ” and “ Technical Talk: Stocks nearing short-term resistance “. (And do make a point of listening to Donald Coxe's webcast of March 20, which can be accessed from the sidebar of the Investment Postcards site.)
Economy
“Global businesses remain remarkably pessimistic. Businesses say that sales fell sharply last week to a new record low and pricing power continues to evaporate as close to one third of businesses say they are cutting prices for their goods and services,” said the latest Survey of Business Confidence of the World conducted by Moody's Economy.com .
According to RGE Monitor , the World Trade Organization said t he collapse in global demand would drive trade volumes down by 9% in 2009 - the biggest contraction since World War II. Trade in developed countries would fall by 10% while in developing countries it would shrink by 2-3%. The fall in global trade in 2009 will be the first negative annual decline since 1982 led by the contraction in global growth, slump in manufacturing activity and capex, and crunch in trade finance. This might be exacerbated by growing protectionist measures around the world.
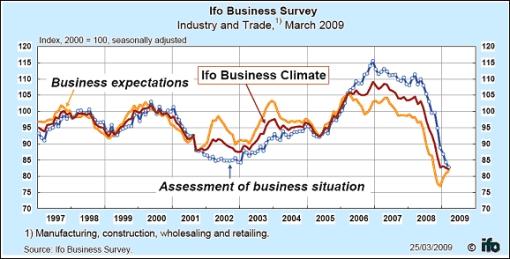
European business confidence has never been as dark and is near record lows, as indicated by the March Ifo Business Survey for Germany.
On a light-hearted note, the Financial Times reported last week that lingerie sales in Britain were looking better than the retail sector as a whole. One CEO in the industry told the FT that couples were staying home more and women were investing in “adventurous apparel” to cheer themselves up during the economic downturn. (Hat tip: US Global Investors - Weekly Investor Alert .)
A snapshot of the week's US economic data is provided below. (Click on the dates to see Northern Trust 's assessment of the various data releases.)
March 27, 2009
• Consumer spending in Q1 most likely to show an increase
March 26, 2009
• Minor Q4 GDP revisions, corporate profits plunge
• Jobless claims - persistent upward trend remains in place
March 25, 2009
• New home sales - notable pickup in sales, but more is necessary
• Durable goods orders - glimmer of strength emerges but it is tentative
March 24, 2009
• Home prices - meaningful turnaround?
March 23, 2009
• Treasury's Public-Private Investment Program - aims to unclog credit markets and promote credit extensions
• Existing home sales advance - noteworthy for several reasons
The past week witnessed a trend of better-than-feared economic reports. Of the twelve reports released, only three were weaker than the consensus forecast. Bespoke said: “While none of these reports can be classified as ‘good', the fact that they are beating expectations is a positive sign. The next test will come this week when we get the first look at reports for the month of March. Will the relative strength follow through, or was the recent string of reports just an aberration?”
“We've passed the period where every indicator is plummeting, and that's good news,” said Nariman Behravesh, chief economist at IHS Global Insight (via The Wall Street Journal ). “We may not be exactly at the turning point, but we're getting pretty close to it.”
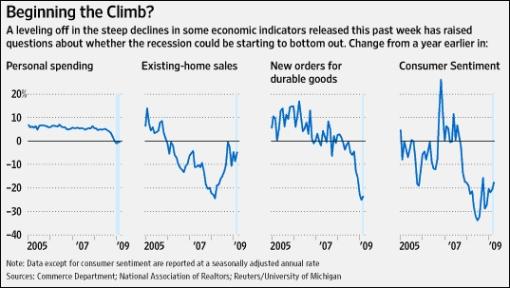
Source: The Wall Street Journal , March 28, 2009.
What are the policy actions required in the US and abroad to lead to a recovery of the global economy and prevent an L-shaped global near-depression? Nouriel Roubini ( RGE Monitor ) summarized the following steps:
• Much more massive unorthodox monetary policy easing;
• Much more fiscal stimulus;
• Resolution of the banking crisis via a takeover of insolvent institutions and recapitalization and removal of toxic assets from the solvent but illiquid and undercapitalized ones;
• Actions to reduce the credit crunch and restore credit growth to creditworthy firms and households;
• Direct reduction - rather than restretching - of the debt burden of insolvent households;
• Tripling of IMF resources and financial help to emerging-market economies that are at risk of a liquidity crisis or a broader financial crisis; and
• Other measures of regulatory forbearance to reduce the procyclicality of the credit cycle (appropriate changes to mark-to-market, reduction in capital adequacy ratios, reduction of the countercyclical role of downgrades by rating agencies).
“Avoiding the L is possible, but it will require much more coherent and aggressive policy actions in the US, China and all over the world,” concluded Roubini.
Week's economic reports
Click here for the week's economy in pictures, courtesy of Jake of EconomPic Data .
Date |
Time (ET) |
Statistic |
For |
Actual |
Briefing Forecast |
Market Expects |
Prior |
Mar 23 |
10:00 AM |
Existing Home Sales |
Feb |
4.72M |
4.43M |
4.45M |
4.49M |
Mar 25 |
8:30 AM |
Durable Goods Orders |
Feb |
3.4% |
-2.5% |
-2.5% |
-5.2% |
Mar 25 |
8:30 AM |
Durables, Ex-Transportation |
Feb |
3.9% |
-2.1% |
-2.0% |
-5.9% |
Mar 25 |
10:00 AM |
New Home Sales |
Feb |
337K |
305K |
300K |
322K |
Mar 25 |
10:30 AM |
Crude Inventories |
03/20 |
+3300K |
NA |
NA |
+1942K |
Mar 26 |
8:30 AM |
Initial Claims |
03/21 |
652K |
645K |
650K |
644K |
Mar 26 |
8:30 AM |
Q4 GDP - Final |
Q4 |
-6.3% |
-6.6% |
-6.6% |
-6.2% |
Mar 26 |
8:30 AM |
GDP Price Index |
Q4 |
0.5% |
0.5% |
0.5% |
0.5% |
Mar 27 |
8:30 AM |
Personal Income |
Feb |
-0.2% |
-0.1% |
-0.1% |
0.2% |
Mar 27 |
8:30 AM |
Personal Spending |
Feb |
0.2% |
0.3% |
0.2% |
1.0% |
Mar 27 |
9:55 AM |
Michigan Sentiment |
Mar |
57.3 |
57.0 |
56.8 |
56.6 |
Source: Yahoo Finance , March 27, 2009.
In addition to an interest rate announcement by the European Central Bank (Tuesday, April 2), the US economic highlights for the week include the following:
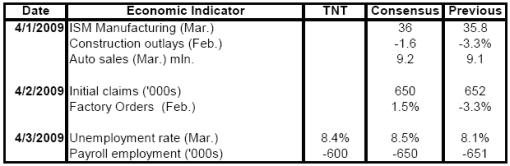
Source: Northern Trust
Click here for a summary of Wachovia's weekly economic and financial commentary.
Markets
The performance chart obtained from the Wall Street Journal Online shows how different global markets performed during the past week.
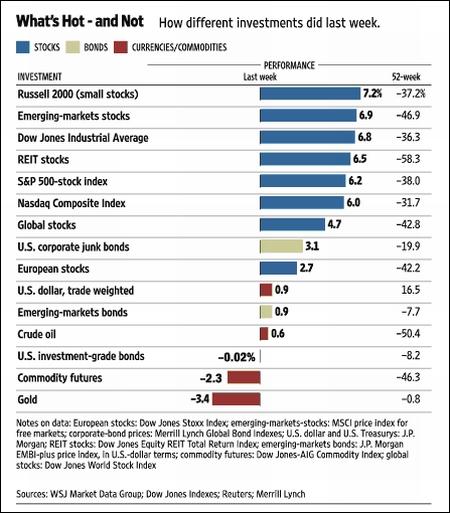
Source: Wall Street Journal Online , March 27, 2009.
Lau-Tzu said: “Those who have knowledge, don't predict. Those who predict, don't have knowledge.” Wise words indeed, but hopefully the “Words from the Wise” reviews will assist Investment Postcards readers with their research to cast some light on the lie of the investment land.
That's the way it looks from Cape Town (where I am about to embark on a long-haul flight to New York and San Diego).
Source: Walt Handelsman
By Dr Prieur du Plessis
Dr Prieur du Plessis is an investment professional with 25 years' experience in investment research and portfolio management.
More than 1200 of his articles on investment-related topics have been published in various regular newspaper, journal and Internet columns (including his blog, Investment Postcards from Cape Town : www.investmentpostcards.com ). He has also published a book, Financial Basics: Investment.
Prieur is chairman and principal shareholder of South African-based Plexus Asset Management , which he founded in 1995. The group conducts investment management, investment consulting, private equity and real estate activities in South Africa and other African countries.
Plexus is the South African partner of John Mauldin , Dallas-based author of the popular Thoughts from the Frontline newsletter, and also has an exclusive licensing agreement with California-based Research Affiliates for managing and distributing its enhanced Fundamental Index™ methodology in the Pan-African area.
Prieur is 53 years old and live with his wife, television producer and presenter Isabel Verwey, and two children in Cape Town , South Africa . His leisure activities include long-distance running, traveling, reading and motor-cycling.
Copyright © 2009 by Prieur du Plessis - All rights reserved.
Disclaimer: The above is a matter of opinion and is not intended as investment advice. Information and analysis above are derived from sources and utilizing methods believed reliable, but we cannot accept responsibility for any trading losses you may incur as a result of this analysis. Do your own due diligence.
Prieur du Plessis Archive |
© 2005-2022 http://www.MarketOracle.co.uk - The Market Oracle is a FREE Daily Financial Markets Analysis & Forecasting online publication.