Best of the Gold and Silver ETF's
Commodities / Credit Crisis 2009 Mar 17, 2009 - 08:17 PM GMTBy: Peter_Degraaf
 Among the Gold and Silver ETF's there is one that is superior to all the rest.
Early on March 17 th Max Hulbert reported that his Gold Newsletter Sentiment Index (which tracks leading gold advisories), had dipped into negative territory.
Three weeks earlier this same index had shown gold analysts to be in a bullish mode by 61%, and now some 15 trading days later, these same analysts are 16.5 bearish, and advising their clients to be short gold for the time being.
For contrarians this is good news, and indicates that a buying opportunity in gold is likely on the horizon. As a rule, gold analysts are most bullish near a top and most bearish near a bottom. What say the charts?

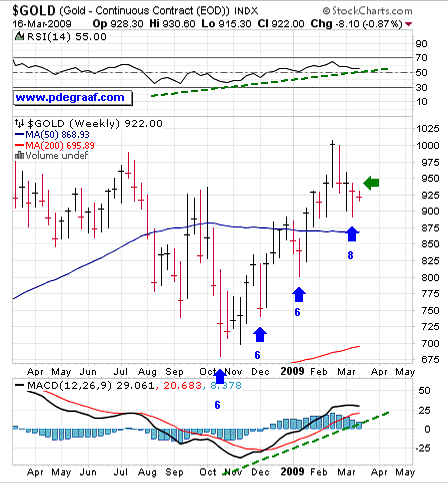
Featured is the weekly gold chart. The blue arrows point to bottoms in the 7 – 8 week gold cycle. Three out of the last cycles lasted just 6 weeks. The latest cycle appears to have bottomed right on schedule, during week number eight. Confirmation that the bottom is ‘in' will come once price closes above the green arrow. The overall trend is up, and the supporting indicators (RSI and MACD) are both positive. A closing price above the green arrow will start the next rally towards the resistance at 1,000.00.
Historically gold almost always puts in a bottom in mid March (THAT'S NOW).

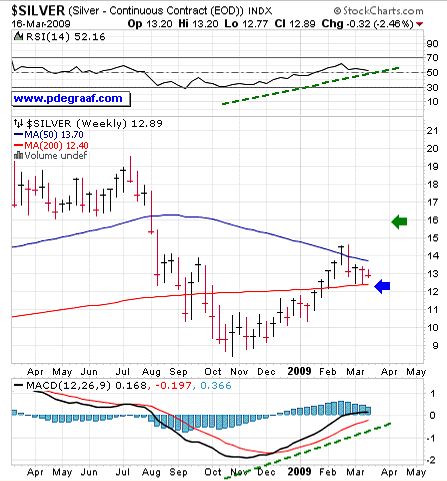
Featured is the weekly silver chart. Price bottomed in October and rose by 75% to 14.75.
The Fibonacci target for the pullback has been met at the blue arrow. The supporting indicators are positive (green lines). As soon as price rises above the 50WMA (blue line), the next target is at the green arrow.
Historically silver almost always puts in a bottom in late February or early March.
So now that you are ready to buy into a gold or silver ETF, why not go for the best of the best? CENTRAL FUND OF CANADA is not called an ETF, but it performs the same function. Founded in 1961, (long before the modern ETF's), CEF operates under the laws of the Province of Alberta Canada .
The founder is its current chairman, Mr. Philip M. Spicer. The company issues shares from time to time at prices that are non-dilutive to its existing owner's net asset value per share, and it always buys additional gold and silver bullion prior to striking a price with the subscribers to its offerings. The company invests in gold and silver and its bullion holdings are always stored on an unencumbered, allocated, segregated and insured basis within a Canadian chartered bank's treasury vault storage facilities. The physical gold and silver bullion is audited on a semi-annual basis in the presence of Ernst & Young LLP, the company's auditors. This auditing factor puts Central Fund head and shoulders above the gold ETF's that have become so popular during the past few years.
The company's shares qualify for inclusion in many North American regulated accounts.
Annual expenses are below 0.45% (low for this type of company). These expenses are taken from the company's cash position. If the company does not have an adequate amount of cash on hand to meet its commitments, a small portion of its holdings may be sold to raise the cash required. The company has not sold any of its bullion holdings for several years and it has enough cash on hand to meet its current level of expenses for several years!
A minimum of 90% of Central's assets are tied up in gold and silver at all times.
Central Fund never leases any of its gold and silver, and for those who worry about a repeat of the 1933 US government gold grab, the fact that this gold is outside of US jurisdiction puts that fear to flight.
Whereas several articles have been published that detail possible risk involved in the investing in GLD and SLV, no such risk exists with Central Fund.
The chairman recently issued this statement: “Our bullion is stored in separate compartments within the bank, with the name of the owner clearly indicated on the compartment, and on top of each pallet of bullion the name of the owner is indicated. This prevents the bank from using the asset for any unauthorized purpose. We also pay Lloyds of London for coverage of any possible loss”.
Daily volume in CEF ranges between 500,000 and 1 million shares. For CEF/A.TO the average is between 100,000 and 200,000 shares per day.
Central Fund updates its financial situation on a daily basis at its website www.centralfund.com As of March 16 th these assets consisted of 1,049,328 ounces of gold (56.9% of total), and 52,460,793 ounces of silver (40.4%). The balance is ties up in cash and other assets. Current market cap is 1.9 billion dollars US – 2.4 billion dollars CDN.
The activities of Central Fund are controlled by a board of directors consisting of people who are knowledgeable in the precious metals field, and all of whom are current shareholders.
To the best of my knowledge CEF qualifies for 401K and CEF/A.TO for RSP investment purposes (but check with your accountant to make sure).
For additional information contact the company at info@centralfund.com

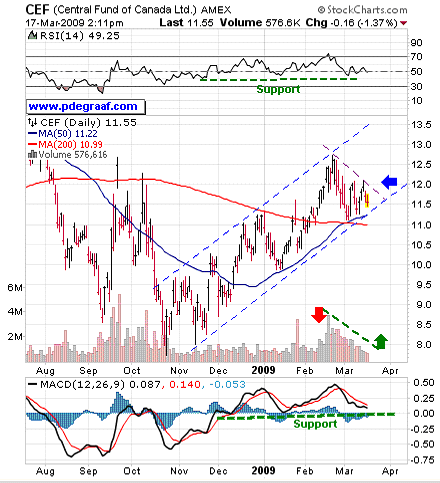
Featured is the CEF daily chart. Price is rising within a well defined channel. Volume been dropping during the latest pull-back (red and green arrows), a positive sign.
The supporting indicators are at support levels (green lines). A breakout at the blue arrow will start the next bullish rally.
Happy trading!
By Peter Degraaf
Peter Degraaf is an on-line stock trader with over 50 years of investing experience. He issues a weekend report on the markets for his many subscribers. For a sample issue send him an E-mail at itiswell@cogeco.net , or visit his website at www.pdegraaf.com where you will find many long-term charts, as well as an interesting collection of Worthwhile Quotes that make for fascinating reading.
DISCLAIMER: Please do your own due diligence. I am NOT responsible for your trading decisions.
Peter Degraaf Archive |
© 2005-2022 http://www.MarketOracle.co.uk - The Market Oracle is a FREE Daily Financial Markets Analysis & Forecasting online publication.


