


Stock Market S&P 500 Trends: 1980 - 2009
Stock-Markets / Stock Market Valuations Mar 13, 2009 - 12:12 PM GMTBy: Richard_Shaw

 Since we are in an historic set of economic conditions, and we have experienced an historic recent decline in equity prices, it is appropriate to examine historical market trends to put this year in perspective.
Linear Chart Analysis:
The following linear chart (equal y-axis height for each price unit of change) plots the annual open, high, low and close for the years 1980 through 2008 (plus the short 2009 year ending 2/27/09).
Linear Long-Term Trend Extension to 12/31/09
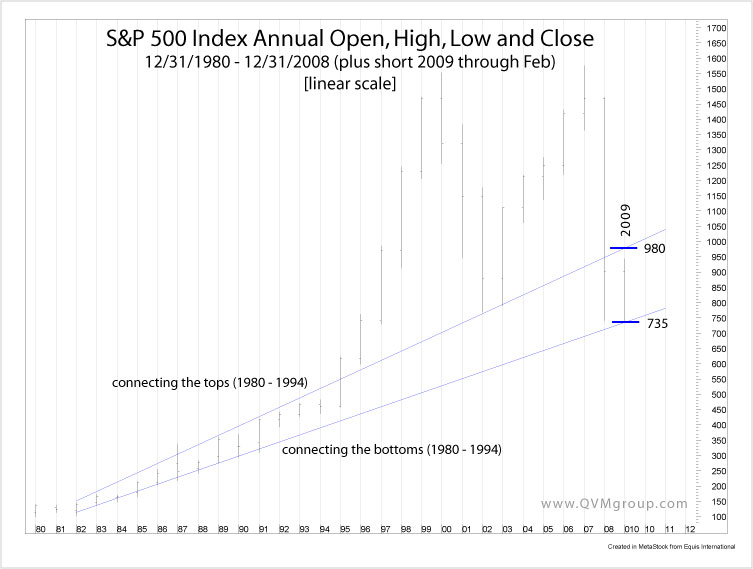
If we draw trends to the current time, but excluding the dot.com period, where might we expect the S&P 500 to close this year?
The trendlines on the linear chart suggest a possible 2009 year-end range of 735 to 980 for the S&P 500.
Semi-Log Chart Analysis:
The following semi-log (equal y-axis height for each price percentage change) plots the annual open, high, low and close for the years 1980 through 2008 (plus the short 2009 year ending 2/27/09).
Semi-Log Long-Term Trend Extension to 12/31/09

In this plot, we extended trendlines from 12/31/1980 across the tops and bottoms through the dot.com bubble (red lines). The blue trendlines connect (A) 1980 and 2003 low, (B) 1980 and 2008 close, and (C) 1980 and 2008 low.
The red trendlines that take the dot.com bubble into consideration suggest virtually impossible year-end 2009 values of 2256 to 5168 — clear evidence that the dot.com era was way out of line, although that point is not generally in contention.
The blue trendlines, that basically ignore the dot.com bubble effect on the long-term, suggest year-end 2009 values of 1344, or 979, or 796 for A, B and C respectively.
In other words, were it not for the 2008 crash, we might have expected to see 1344 for 2009 — still down from 2007 levels. Given the 2008 crash, we might more reasonably expect 796 to 979 for 2009.
The four key projections (two from the linear extensions and the two 2008 crash related semi-log extensions) give us a range of 735/796 to 979/980 for year-end 2009.
As this article is being written the S&P 500 stands at 750.
How Does the Trendline Analysis Square With Fundamentals?
Morgan Stanley : They updated their 2009 year-end projection for the S&P 500 today. They see 825. That falls somewhere in the middle of the trendline extensions. They predict a fall to 560 for the index from the current level, however, before climbing to end the year at 825, according to Bloomberg.
They said home prices need to stabilize, financial firms must report smaller losses and earnings at U.S. companies have to improve before they become more bullish on equities
Bloomberg TV reported that Morgan Stanley predicts index earnings of $40 and $56 for 2009 and 2010 (although they did not disclose whether those estimates are total “as reported” or total operating earnings (”ex items”). We suspect Morgan Stanley used operating earnings.
At 825, the Morgan Stanley projection would be a rounded 21 P/E on trailing basis, and a rounded 14 P/E on a nearly 2-year forward basis.
Various : As of February 26th, according to Bloomberg, these are the 2009 year-end S&P 500 index predictions from analysts at various firms:
- Goldman Sachs: 940
- UBS: 1100
- Barclays: 940
- Av of Ten Analyst Followed by Bloomberg: 1010
Goldman said home prices haven't stabilized and losses for financial institutions aren't diminishing, and that “Improvement in credit-related losses in financials (which are linked to home prices) and clarity surrounding fiscal policy are critical for the S&P 500 to begin a sustained rally.” They predicted $40 and $63 index earnings for 2009 and 2010.
UBS predicts $51 and $63 earnings for 2009 and 2010.
Nouriel Roubini (March 9) predicts $50 earnings for 2009 (with a 12 multiple to get to 600 for a year low, and possibly a 10 multiple to get to $500).
Standard and Poor's : S&P Senior Index Analyst Silverblatt says “Massive charges warp P/Es … forward numbers more important - but many investors have a lack of trust in the estimates.”
He points out that 19% of S&P 500 index companies have negative operating earnings, including some with mega-billion losses. He also states that overall index sales are down 9.13%; with 41% of index companies reporting higher YOY sales (avg +6.86%), and with 59% of index companies reporting lower YOY sales (avg -17.93%)
Here are the S&P index earnings history and projections from Standard and Poor's:

Note that estimated 2009 index dividends are down 25% from 2008 to a level somewhat below the dividends paid in 2005.
Based on the current 750 index level, we are looking at trailing 2009 “operating” earnings (means excluding write-downs and “non-recurring” charges) of 11.7 to 15.6, depending on whether you rely on their bottom up or top down method. Using their top down “as reported” earnings (meaning including write-downs and “non-recurring” charges) we see a 2009 trailing P/E of 23.1.
For 2010, based on projected operating earnings and today's 750 index level, we see a projected trailing operating earnings P/E of 16.0, and a projected trailing “as reported”earnings P/E of 18.9.
The most we could say from that data is that at 750 the index is probably fully valued. If the index were to be at a median 15 P/E for trailing “as reported” earnings, it would be at 600 in 2010. At an optimistic 20 times trailing “as reported” earnings, the index would be at 800 at the end of 2010.
Contrary View:
Jeremy Grantham, long-time bear, maintains his January view that the Standard & Poor's 500 Index may fall below 600 before rebounding, but that you can't catch the bottom, and should therefore begin accumulating stocks now before cash and decision “rigor mortis” sets in.
Conclusion:
We find no fundamental and no charting basis for the S&P 500 to be charging up very high from here at this time, under the current economic conditions. See our article earlier today, “ Winter Warming, More Snow to Come ”
As for clarity and visibility, Larry Summers (Harvard economist, former Treasury Secretary under Clinton, and head of Obama's National Economic Council) said today “no one can know when the crisis will end”.
With a government policy dependent economy and stock market, we think that level of cautionary statement, should probably cause investors with mature portfolios to wait for more “proof” that the situation will come under control, or to wait for a deeper discount in market prices, before taking more equity risk.
On the other hand, if you share Grantham's concerns about becoming locked into a bear mindset, and if you have confidence in year-end projections in the 900+ range, and if you are emotionally and financially capable of being wrong, and if you can wait several years for a stock commitment to work out, then buying stocks today is not crazy — however, it's not something we are ready to do with our own money just yet.
By Richard Shaw
http://www.qvmgroup.com
Richard Shaw leads the QVM team as President of QVM Group. Richard has extensive investment industry experience including serving on the board of directors of two large investment management companies, including Aberdeen Asset Management (listed London Stock Exchange) and as a charter investor and director of Lending Tree ( download short professional profile ). He provides portfolio design and management services to individual and corporate clients. He also edits the QVM investment blog. His writings are generally republished by SeekingAlpha and Reuters and are linked to sites such as Kiplinger and Yahoo Finance and other sites. He is a 1970 graduate of Dartmouth College.
Copyright 2006-2009 by QVM Group LLC All rights reserved.
Disclaimer: The above is a matter of opinion and is not intended as investment advice. Information and analysis above are derived from sources and utilizing methods believed reliable, but we cannot accept responsibility for any trading losses you may incur as a result of this analysis. Do your own due diligence.
Richard Shaw Archive |
© 2005-2022 http://www.MarketOracle.co.uk - The Market Oracle is a FREE Daily Financial Markets Analysis & Forecasting online publication.