


Stocks Bear Market Elliott Wave 4 Rally Due
Stock-Markets / Stocks Bear Market Mar 09, 2009 - 01:15 AM GMTBy: Andre_Gratian

 Current Position of the Market
SPX: Long-term trend -
Down! The very-long-term cycles have taken over and if they make their lows when expected, the bear market which started in October 2007 should continue until 2012-2014. This would imply that much lower prices lie ahead.
SPX: Intermediate trend - We are probably within 2 or 3 weeks of starting a counter-trend move of intermediate nature. Technical signs are becoming very favorable in diverse areas of the market.
Analysis of the short-term trend is done on a daily basis with the help of hourly charts. It is an important adjunct to the analysis of daily and weekly charts which determines the course of longer market trends.
Daily market analysis of the short term trend is reserved for subscribers. If you would like to sign up for a FREE 4-week trial period of daily comments, please let me know at ajg@cybertrails.com .
Overview:
On Friday, in conjunction with the report of the highest unemployment rate in 25 years, the big cap indices reached their lowest point since 1997. The Nasdaq, Russell, and Value line have remained above their 2002 lows.
Stocks have been coming down relentlessly since early January, during which time the Dow came down from 9000+ to a little below 6500, and the SPX from 943 to 667. Just before the week's close, a rally transformed another day of deep losses into a slight positive. Did we finally find an important low? Probably not, but Friday the market either made a short-term low, or it will do so next week.
Perhaps it is best to explain where we are in terms of market structure. Elliott Wave technicians have been looking for the end of the down-wave which started at 885 and which is deemed to be a minute wave 3. It has extended longer than what was anticipated. There are 2 potential counts for that wave, the less favored of which is that we completed it on Friday. The preferred count is that we need one more small down wave to conclude it, and that it will come early next week.
While many expect the current pattern from 943 to represent the final 5th wave from the 10/07 top, there are some who believe that 11/21/08 was only the end of minor wave 3 of intermediate 3, and that int. 3 is still ahead of us. I am increasingly of that opinion.
We'll try to sort it out with the indicators, but if we are only looking for a completion of minute 3 at this time, that would mean that there will be a short-term rally starting no later than next week (minute 4) and then would come minute 5 to a new low, to conclude both minor 5 and intermediate wave 3. This would be when, ideally, we would start a rally that will make it look, to some, as if the bear market is over. It won't be! It will only be intermediate wave 4, with another severe decline to new lows by intermediate wave 5, but it could give us 300 points in the SPX.
It will be easier to illustrate the above Elliott Wave count on a weekly chart of the SPX.
Let's do some technical analysis and see if it confirms the above scenario.
What's ahead?
Chart Pattern and Momentum
On the following daily chart, the main channel represents an approximation of the trend from the October '07 top. All the oscillators have been in a downtrend since early January and, after a brief up-move, in another since the index printed 875, in early February. The overbought/oversold index (middle) is currently oversold and is beginning to show some positive divergence. The positive divergence is more pronounced in the lower oscillator, which is that of the A/D. This is a sign of an impending low. In the Market Overview, we suggested that Friday could have seen the bottom of the decline from 875, and that a better bet would be early next week. Either would satisfy the count to complete minute wave 3. This would create a short-term rally which could have started on Friday. If the EW analysis is correct, It should be short-lived and followed by another decline into the low of intermediate wave 3. After that, the biggest bear market rally of the entire decline would soon start.
As usual, we go to the hourly chart for a better view of the short term. Here, also, positive divergence is exhibited by all indicators signaling an imminent rally. Technically, the only thing that suggests that a little more weakness might lie ahead, is that in spite of the closing rally on Friday, the A/D closed with a substantial reading of minus 828. Those who follow short-term cycles are also betting on next week. EW analysts could have it either way, but would prefer next week also. So we'll let the market tell us. A confirmation that minor wave 3 has made its low will come when the index rises above the black downtrend line and the former top of 700.
The green channel has confined prices since 875 and represents minute wave 3. Minute wave 4 should take us out of it. The black trend lines are potential support lines.
Cycles
The Hurst 18-mo cycle has come and gone with no impact on the market. It probably bottomed in the 3rd week of January.
We should be in the time window of the 20-wk cycle bottom, and it could mark the end of the decline from 875.
A short-term cycle is also due next week, about mid-week.
Except for a few, short and intermediate traditional cycles have had little effect on a market which is being driven more by fundamentals and by the bottoming of very-long term cycles. Fibonacci relationships have also played an important part.
Projections:
Projections closely correspond to the beginning and end of Elliott waves, even the short ones. Recent projections given to subscribers were right on the mark. On Friday, the following email went out:
----- Original Message -----
From: Andre Gratian
Sent: Friday, March 06, 2009 12:28 PM
Subject: Market Update
Total lack of buyers! Approaching 668 projection. With positive divergence everywhere, traders could force another short-covering rally!
Andre
The low came at 666.79, and a closing rally took the SPX up 27 points.
There was a near-term Point & Figure projection to 684, which is where the index rallied into the close. The next near-term one is at 690. More important projections will be given if the move surpasses 700.
On the downside, there has been a standing projection of about 650, recently revised to 636 which could turn out to be the low of intermediate wave 3.
Breadth
As shown in the daily chart, above, the A/D oscillator has been resisting making a new low for about two weeks, while the SPX gave up another 57 points. This is strong positive divergence which normally signals the approach of a significant reversal.
On Friday, the hourly A/D figures, although very negative for most of the day, were much less negative than the day before, even though the index was making new lows (positive divergence). This was also a signal that a reversal was due shortly.
The McClellan Summation Index graph (courtesy of StockCharts) shows that it has come down steadily as the market has moved lower. However, after making a higher high, it is in the process of making a higher low, with its RSI oversold. This is evidence of positive divergence on an intermediate basis.
We are seeing positive divergence on an intermediate, short-term, and very short-term basis. The breadth indicators strongly support the occurrence of a significant reversal in the near future.
Market Leaders and Sentiment
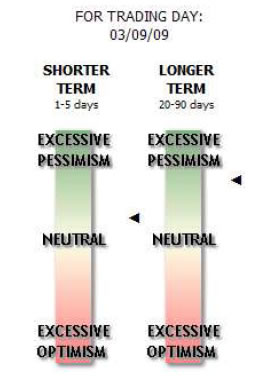
The next graph (courtesy of Sentimentrader) gives us readings on the current short-term and longer term sentiment.
While the short-term is positive, but still close to neutral, the longer term gauge is very positive, also indicating that a fairly important low is near.
The NDX is moving in tandem with the SPX in the short-term, but over the longer term, it is resisting the market decline much better and is still trading above it's November low. If it should start to show relative strength to the SPX short-term, if would also be a signal that we are near reversing.
Summary
There is ample evidence that we are approaching an intermediate-term rally. Positive divergence in breadth in all time frames is particularly obvious.
The new highs and new lows are also showing the same divergence. At the November low, there were 1527 new 52-week lows. Last Friday, only 827.
If the Elliott Wave interpretation given above is correct, we are approaching the completion of intermediate wave 3, and intermediate wave 4 would produce a significant rally.
The following are examples of unsolicited subscriber comments:
Awesome calls on the market lately. Thank you. D M
Your daily updates have taken my trading to the next level. D
… your service has been invaluable! It's like having a good technical analyst helping me in my trading. SH
I appreciate your spot on work more than you know! M
But don't take their word for it! Find out for yourself with a FREE 4-week trial. Send an email to ajg@cybertrails.com .
By Andre Gratian
MarketTurningPoints.com
A market advisory service should be evaluated on the basis of its forecasting accuracy and cost. At $25.00 per month, this service is probably the best all-around value. Two areas of analysis that are unmatched anywhere else -- cycles (from 2.5-wk to 18-years and longer) and accurate, coordinated Point & Figure and Fibonacci projections -- are combined with other methodologies to bring you weekly reports and frequent daily updates.
“By the Law of Periodical Repetition, everything which has happened once must happen again, and again, and again -- and not capriciously, but at regular periods, and each thing in its own period, not another’s, and each obeying its own law … The same Nature which delights in periodical repetition in the sky is the Nature which orders the affairs of the earth. Let us not underrate the value of that hint.” -- Mark Twain
You may also want to visit the Market Turning Points website to familiarize yourself with my philosophy and strategy.www.marketurningpoints.com
Disclaimer - The above comments about the financial markets are based purely on what I consider to be sound technical analysis principles uncompromised by fundamental considerations. They represent my own opinion and are not meant to be construed as trading or investment advice, but are offered as an analytical point of view which might be of interest to those who follow stock market cycles and technical analysis.
Andre Gratian Archive |
© 2005-2022 http://www.MarketOracle.co.uk - The Market Oracle is a FREE Daily Financial Markets Analysis & Forecasting online publication.