


Stock Market Valuations, Siegel vs Standard & Poor's
Stock-Markets / Stock Market Valuations Feb 28, 2009 - 02:34 PM GMTBy: Richard_Shaw

 (WSJ Feb 25, 2009) “The S&P Gets Its Earnings Wrong, Stocks are cheaper than they look”, by Jeremy J. Siegel
Economist Jeremy Siegel (associated with WisdomTree funds, and professor at Wharton) is an important figure. When the Wall Street Journal published his editorial ( read full article ) claiming that Standard & Poor's had a flawed method that massively overstates the S&P 500 P/E, that became something that can't be ignored. In fact, Siegel said if S&P had calculated index earnings correctly, investors would see that stocks are historically undervalued.
The blogosphere came alive with comments that spanned the gamut from agreement to disagreement in both polite in impolite tones.
Several of our clients called to inquire, since we have been telling them that stocks are expensive and that the index needs to fall significantly to come in line with current realities, and to be in the lower range of historic P/E valuation.
Rather than joining the throng of “top of mind” commenters, we decided to ask S&P how they do their work.
Of course, they disagree with Siegel. They referred us to their publication on the mathematics of their indexes ( download it here ).
Our Conclusion:
- Siegel may or may not be correct in asserting that there is a better way — we have not attempted to analyze that
- The S&P method does not appear to be inconsistent or illogical, as Siegel claims — not surprising after decades of publication and significant competition from MSCI, Dow Jones, FTSE and others who had incentive to point to any logical flaws in the S&P method
- The S&P method, flawed or not, has been consistently applied for a long time, making historical comparison of current P/E ratios with prior P/E ratios useful
- Siegel has not provided historical P/E ratios calculated on his basis, rendering his method useless in terms of historical analysis until he restates and publishes historical results using his method
- Siegel created his own logical flaw by attempting to prove his point by comparing the current P/E, based on his alternate index earnings calculation, to historical P/E ratios based on the S&P method, which he claims is wrongly calculated.
- Our 81-year analysis of monthly P/E ratios, based on the S&P method ( see our Nov 3, 2008 article ), finds the historical range of P/Es to be 10 to 20, with 15 as a median — and based on that, the S&P projections of index P/E's in the vicinity of 20 and up makes the current S&P 500 index expensive.
- Expensive markets in bad economies — and this is a bad global economy — are more likely to fall than to rise.
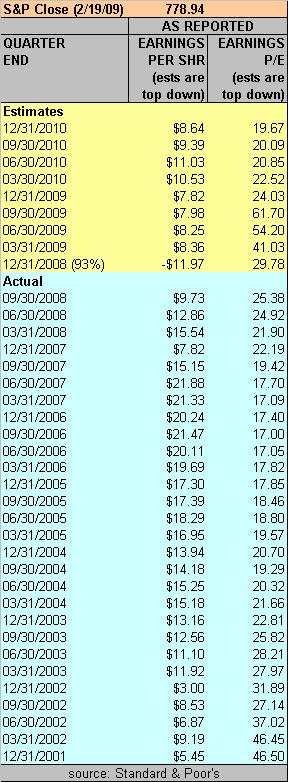
S&P Earnings and P/E Calculations:
This table is adapted from a spreadsheet available on the S&P website ( download it here ).
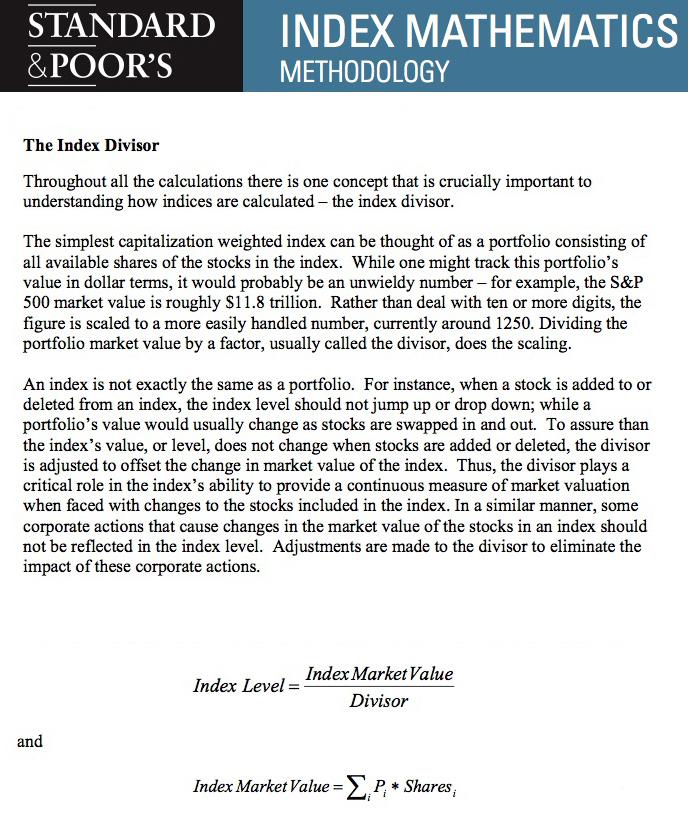
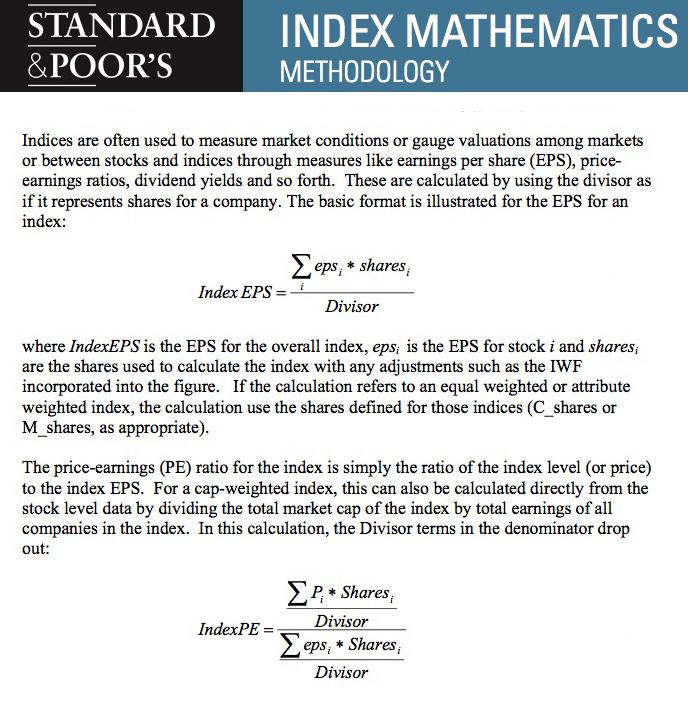
S&P Index Calculation Mathematics:
The images that follow are a relevant collage of extracts from the S&P methodology document which you can download above and read in full.
The Siegel Opinion Letter Excerpts:
Standard & Poor's recently shocked investors with an announcement that reported earnings for its S&P 500 Index for the fourth quarter of 2008 are forecast to be negative for the first time since such data were calculated in 1936. …
What this dismal news actually reflects is the bizarre way in which S&P (and most other index providers) calculate “aggregate” earnings and P/E ratios for their indexes. …
If one applies market weights to each firm's earnings using the same procedure that S&P employs to compute returns, the results yield a more accurate view of the current profit picture. Market weights produce a reported earnings estimate of $71.10 for 2008 — nearly 80% higher than the unweighted procedure. …
No one can deny that the recent economic downturn has badly hurt corporate earnings. But let's not fool ourselves into thinking that this is an expensive market. When computed accurately, P/E ratios show that this market is much cheaper than is currently being reported by the S&P.
Fundamentals and Chart Pattern Perspectives:
Fundamentals suggest applying a 10 to 15 multiple (the bottom 1/2 of the main range) in this negative environment — better closer to 10 that to 15. Combining that with an S&P 2010 index earnings projection of about $40, makes a 400 to 600 price range for the index more plausible than an 800 to 1200. Either one could happen, but we think odds favor the lower more than the higher range.
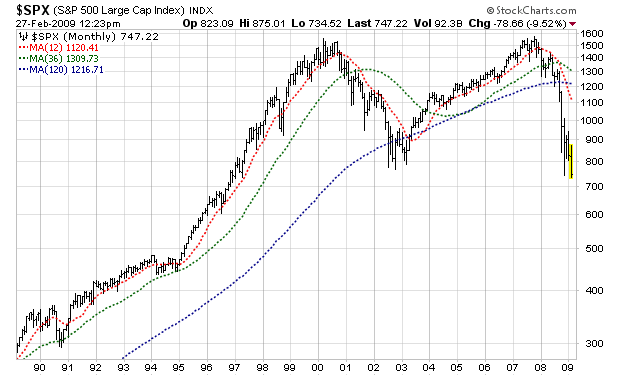
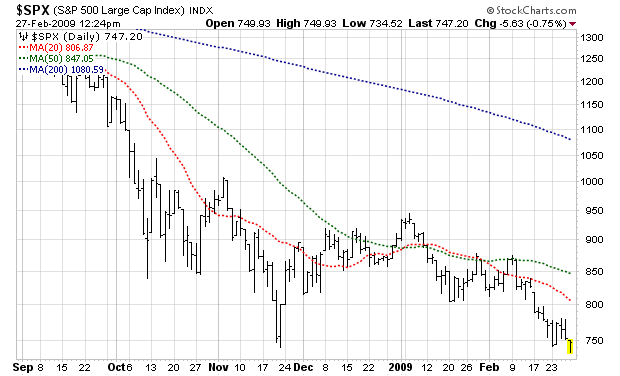
Visible chart patterns , can be the arbiter of the truth. The prices are clearly and visibly going down, as the charts below show. Until the charts show signs of pointing up, the lower 400 to 600 range seems more likely than the upper range of 800 to 1200.
20-Year Monthly S&P 500 Prices
6-Months Daily S&P 500 Prices
Summary:
We are sensitive to the anxiety many investors feel sitting in money market funds with some or all of their stock allocation, earning less than 1% (in some cases a lot less than 1%). That's hard to do. However, a 1% gain looks really good to us in comparison to a probable significant capital loss.
Some investors may believe that they can ignore the possible lows between here and new highs. Some investors are early in the investment accumulation stage of life. For them, perhaps risking the stock allocation now and waiting for gains may be acceptable.
Other investors cannot ignore the the in-between period, because they are done accumulating assets, possibly living off of their assets, or are not able to replace their capital with new earnings. For them, there is no reason or need or capacity to suffer losses though the in- between period (which could be long, although it may be short). For them, we don't believe risking now is appropriate.
The S&P 500 is fundamentally expensive, the Siegel opinion notwithstanding. The S&P 500 price is trending down, not up. We completely exited the US stock market in July of 2008 and will not re-enter until it makes visible price chart sense — not before — not now.
We don't buy what is falling. We buy what is rising.
We will gladly change our view when, and only when, the charts show credible evidence of a reversal of the obvious current downward trend. We don't intend to risk capital on what “ought to”, “should”, “might”, “could” or “someday” will happen to prices, or on what spokespersons for asset gathering / asset fee dependent enterprises say we should do. We will risk capital on what “is” happening to prices, and are more than willing to give up the earliest upward movements to be assured that prices are in fact “trending” up, not just bouncing around in a sucker rally.
Our cash and our client's cash is simply too precious to speculate on a situation where both fundamental logic and price charts are flashing warnings. Cash needs to be conserved and held aside until observable price action reality, preferably confirmed by fundamental logic, indicates a market trend reversal to the upside.
By Richard Shaw
http://www.qvmgroup.com
Richard Shaw leads the QVM team as President of QVM Group. Richard has extensive investment industry experience including serving on the board of directors of two large investment management companies, including Aberdeen Asset Management (listed London Stock Exchange) and as a charter investor and director of Lending Tree ( download short professional profile ). He provides portfolio design and management services to individual and corporate clients. He also edits the QVM investment blog. His writings are generally republished by SeekingAlpha and Reuters and are linked to sites such as Kiplinger and Yahoo Finance and other sites. He is a 1970 graduate of Dartmouth College.
Copyright 2006-2009 by QVM Group LLC All rights reserved.
Disclaimer: The above is a matter of opinion and is not intended as investment advice. Information and analysis above are derived from sources and utilizing methods believed reliable, but we cannot accept responsibility for any trading losses you may incur as a result of this analysis. Do your own due diligence.
Richard Shaw Archive |
© 2005-2022 http://www.MarketOracle.co.uk - The Market Oracle is a FREE Daily Financial Markets Analysis & Forecasting online publication.