


Is the Stock Market Risk Increasing or Decreasing?
Stock-Markets / Stock Index Trading Feb 14, 2009 - 04:24 PM GMTBy: Marty_Chenard

 The Relative Strength Indicator with a setting of 30 days is one of the most important technical tools to use. Its daily reading level and its trend tell's investors how much risk there is, AND if the risk is decreasing or increasing.
For today, let's look at the SPY vs. its current Relative Strength level and its trend.
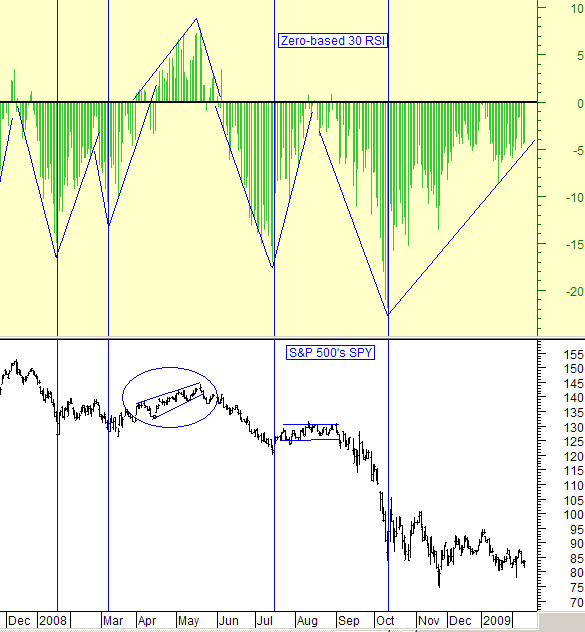
Below is a chart with a zero-base 30 RSI. To zero base it, I simply subtract 50 from the indicator's reading. That makes zero the pivot line between being positive or negative.
As you can see below, zero-basing the RSI makes makes it really easy to interpret .... below zero is negative, and above zero is positive.
Take a look at the chart, and you will see that the only safe upside rally since 2008 was when our zero-based RSI was positive.
So, let's look at the current condition.
1. The zero-based RSI is Negative. This means that there is no "rallying support-strength" behind the market right now.
2. At the same time, you can see that the trend since the end of January is up on the RSI. It is moving up while still in negative territory. (Jan. 20th. is the point where the RSI was recently touching the rising blue support line.)
The conclusion : There is no supporting strength condition for a rally at this time. While any market-long positions are under high risks, the amount of risk has been decreasing since January 20th. There is still a lot of work to be done in order for the zero-based RSI to reach the zero line and then move positive . (This chart is posted and updated every day on our paid subscriber site in Section 4, Chart #5.)
________________________________________________
*** Feel free to share this page with others by using the "Send this Page to a Friend" link below.
By Marty Chenard
http://www.stocktiming.com/
Please Note: We do not issue Buy or Sell timing recommendations on these Free daily update pages . I hope you understand, that in fairness, our Buy/Sell recommendations and advanced market Models are only available to our paid subscribers on a password required basis. Membership information
Marty Chenard is the Author and Teacher of two Seminar Courses on "Advanced Technical Analysis Investing", Mr. Chenard has been investing for over 30 years. In 2001 when the NASDAQ dropped 24.5%, his personal investment performance for the year was a gain of 57.428%. He is an Advanced Stock Market Technical Analyst that has developed his own proprietary analytical tools. As a result, he was out of the market two weeks before the 1987 Crash in the most recent Bear Market he faxed his Members in March 2000 telling them all to SELL. He is an advanced technical analyst and not an investment advisor, nor a securities broker.
Marty Chenard Archive |
© 2005-2022 http://www.MarketOracle.co.uk - The Market Oracle is a FREE Daily Financial Markets Analysis & Forecasting online publication.