


Stock Market Trends February 2009: Bear Market Rally
Stock-Markets / Stocks Bear Market Feb 04, 2009 - 02:50 PM GMTBy: Hans_Wagner

 This is a free monthly newsletter on stock market trends to help you to learn to invest. Following the trend is a proven way to beat the market and grow your stock portfolio. Basic technical analysis provides the tools to identify and follow the market trends using the S&P 500.
To identify the stock market trend, it is best to begin with the big picture in mind and then work our way down to weekly and then daily views of the charts. You will notice that the chart and the value of the indicators change as we move from a monthly to a weekly and then a daily chart. This is a normal part of the technical analysis.
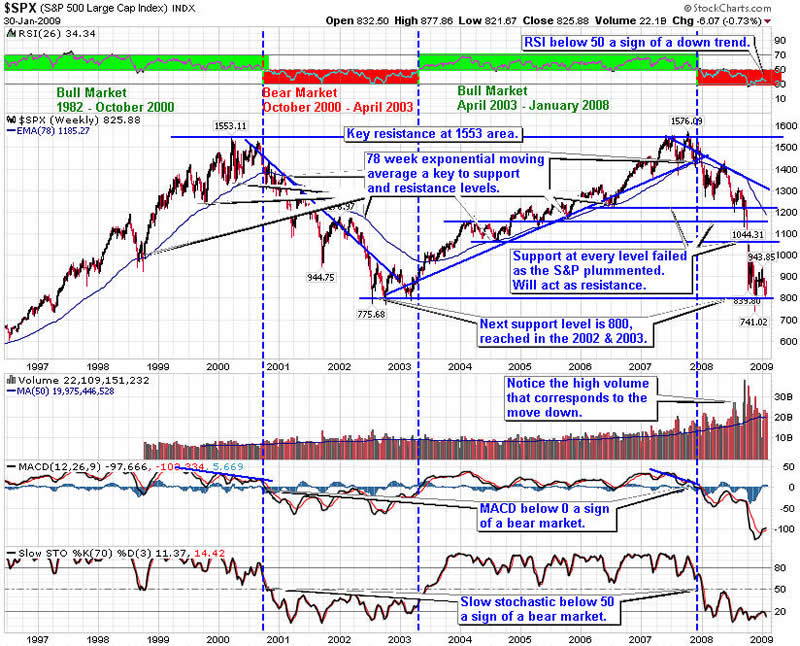
Starting with the long-term view of the S&P 500, you can see peak resistance was reached at the same level at the end of the bull market of 2000 and the bull market of 2008. The S&P 500 has fallen to the lows of 2002 - 2003, the last bear market. This does not mean the current bear market is over. Rather we might see a rally for several weeks to months before retesting of the lows of this bear market.
The Relative Strength Index (RSI) is a good indicator of the cyclical bull and bear markets. In addition, the 78 week Exponential Moving Average (EMA) acts as support in a bull market and resistance in a bear market.
In January 2008, we fell into a bear market as the RSI dropped below 50. The index fell through the rising trend line and the 78-week exponential moving average and MACD crossed below zero. This is consistent with the fundamentals of a weakening economy, and a recession. In a bear market, the general trend is down. Investors should have down side protection in place and use the short Exchange Traded Funds (ETFs) to capture additional profit.
Recently, the MACD is turning up, giving a buy sign. This means we have reached an interim bottom, not an overall market bottom. The Slow Stochastic is poised to rise up through 20, another buy sign when it does.
The 78-week exponential moving average and the bear market down trend remain as key resistance for the bear market.
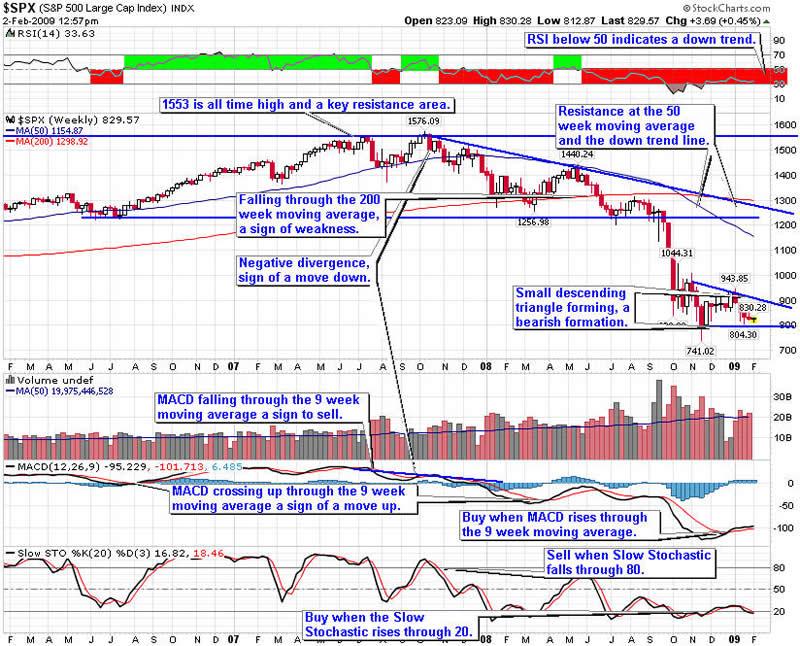
The three-year weekly S&P 500 chart shows more closely the transition from a bull to a bear market. So far, the descending trend line and the 50-week moving average are the primary resistance for this bear market.
Most recently, the index formed a descending triangle pattern, a bearish formation. If the index breaks down through support, the market is likely to fall further. On the other hand, if it breaks out through the descending trend line, we could see up trend in the stock market.
RSI below 50 indicates a downtrend. MACD turned up through the nine-week moving average, a buy sign. Slow Stochastic rose through 20, another buy sign, though it is turning down, a sign of weakness.
Long term the trend in the stock market is still down, although we are likely to see consolidation at this level and possibly a rally up to 1,000 and maybe even resistance at the 1200 area.
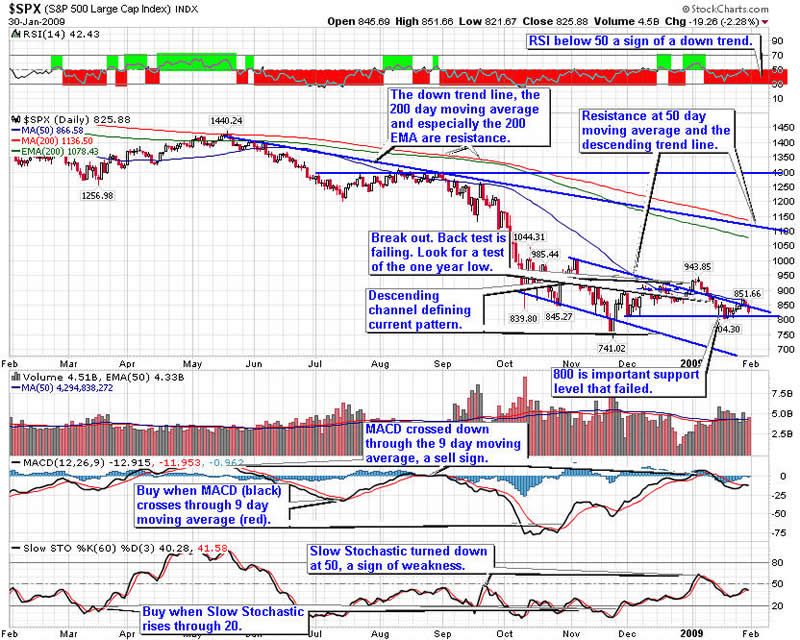
In the daily S&P 500 chart below, a descending channel has formed. The S&P 500 is trying to break up through the upper descending trend line and the 50-day moving average. To break through, we need to see above average volume, or the market will continue to either fall, possibly testing the lows reached in November 2008.
RSI is below 50 indicating a downtrend. Earlier the MACD rose up through the nine-day moving average, a buy sign. It encountered resistance at the zero level and turned down, a sign of weakness. The Slow Stochastic signaled a buy when it moved up through 20. However, the Slow Stochastic turned down as it rose through 50, a sign of weakness. The indicators are telling us the market is at a decision point, either continuing to rally if it can move up or pull back and test prior lows.
If you are long, you should considering selling at least half of your position and/or adding down side risk protection on any move down.
If the rally continues, then significant resistance will be encountered at the 200 simple and exponential moving averages, and the descending trend line.
In bear markets, it is best to be nimble and/or use risk protection such as trailing stops, protective put options and even covered call options. On a sign the market is unable to penetrate resistance, you might consider using the short and ultra short Exchange Traded Funds (ETFs).
Given this perspective, it is important to have your portfolio positioned for a short-term rally and a long-term bear market. This means investors should assess their long positions to reduce risk and be ready for a pull back to prior lows. When the market falls during a bear market, you should either be in cash or be short. The short and ultra short ETFs are good ways to short the market without having to depend on selecting specific stocks.
While it is tempting to buy when the market falls, it is a better strategy to be sure the stock market trend is in your favor. Most likely the prices of many companies will be even lower. Following the stock market trend works. That doesn't mean you cannot buy high quality companies that are in sectors that are trending up. Just keep in mind, Warren Buffett's first rule of investing is to not loose money. Patience is key when markets are moving down.
To learn to invest by analyzing market trends using technical analysis I suggest reading: Technical Analysis: The Complete Resource for Financial Market Technicians by Charles D. Kirkpatrick and Julie R. Dahlquist. Superb job explaining technical analysis for those new to technical analysis, as well experienced practitioners
By Hans Wagner
tradingonlinemarkets.com
My Name is Hans Wagner and as a long time investor, I was fortunate to retire at 55. I believe you can employ simple investment principles to find and evaluate companies before committing one's hard earned money. Recently, after my children and their friends graduated from college, I found my self helping them to learn about the stock market and investing in stocks. As a result I created a website that provides a growing set of information on many investing topics along with sample portfolios that consistently beat the market at http://www.tradingonlinemarkets.com/
Copyright © 2009 Hans Wagner
Hans Wagner Archive |
© 2005-2022 http://www.MarketOracle.co.uk - The Market Oracle is a FREE Daily Financial Markets Analysis & Forecasting online publication.