


Stock Markets Leading Indicators : Part1
Stock-Markets / Global Stock Markets Apr 26, 2007 - 01:31 AM GMTBy: Donald_W_Dony

After over four years of near uninterrupted advancing, the stock markets have now pushed through into all-time highs. The question for most investors is centred on the probability of the continuation of this current trend. Recent fundamental data points to the risk of a cooling economy in the second half of 2007 accompanied with lower interest rates.
Concern for the U.S. housing market and its potential impact also looms over the gradually expanding North American economies. Yet in spite of these challenges, equity markets trade higher month after month. This report is the first in a two part series reviewing the key leading indicators of the stock markets and their implications.
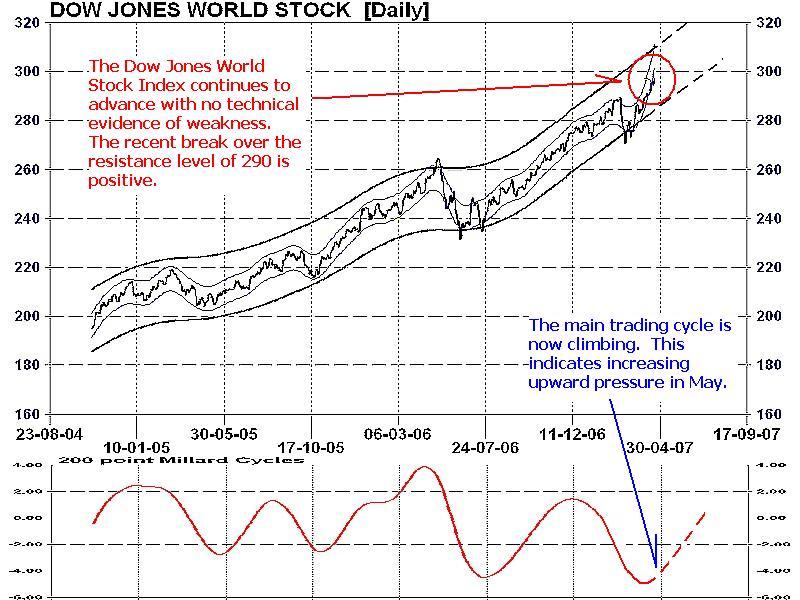
The Dow Jones World Stock Index (Chart 1) is the best measure of global equity markets. This index of over 3,000 companies from 120 countries shows a clear path of higher numbers moving into the summer months. Technical evidence from the main trading cycle (lower portion of Chart 1) indicates a low in mid-April and rising throughout May and June.
Recognising the primary trend for this pulse of world stock markets is very important for understanding and forecasting future market movements on individual equity indexes. This is because global markets are so tightly linked together nowadays that the possibility of a separate major index moving counter to the path of the majority is highly remote. Stock markets trend in unified directions today thanks to the instant exchange of information. World stock indexes from completely different regions of the world and economies will turn in the same week and often on the same day. Therefore the trading direction of this key index speaks volumes about the future direction of individual markets. The target for the Dow Jones World Stock Index is 319 by late summer.
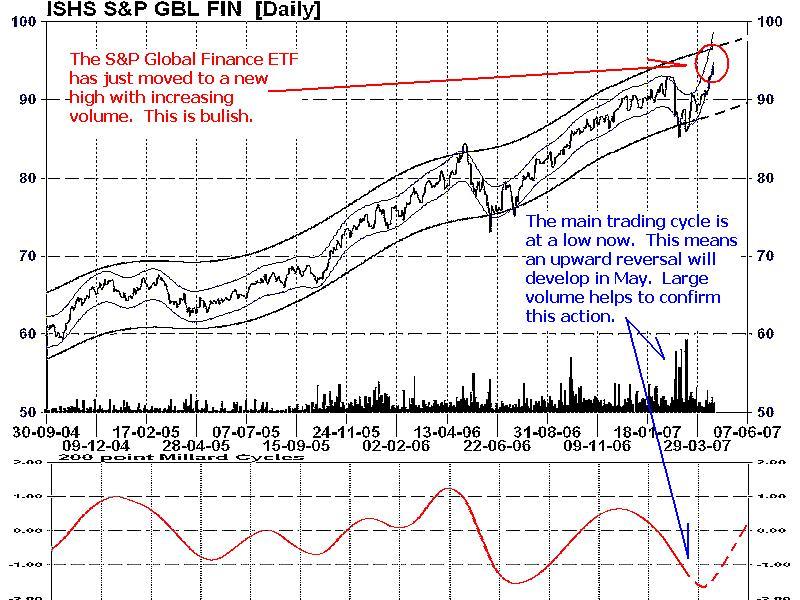
Financial sectors are reliable leading indicators on the general equity markets because this group reacts faster to rising or declining interest rates. Chart 2 displays the exchange traded fund (ETF) of the S&P Global finance iShare. This security continues to advance higher with mounting buying volume. The main trading cycle, like the Dow Jones World Stock Index, has reached a bottom in mid-April and will be gradually turning up over the next few months.
As world economies continually expand over the next year or two, increasing inflationary pressures will develop. This action should force central banks to slowly raise their rates which ultimately will reduce the profit margins within the financial sector. This reduction of profits is manifested in lower share prices. Financial groups will feel this pressure first before most other sectors. For this reason, the financial group is regarded as a very important leading indicator.
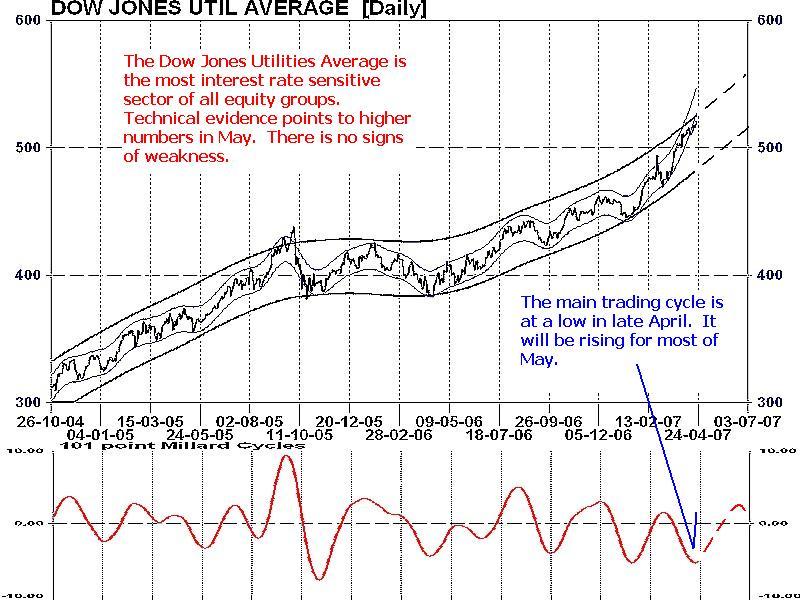
The Dow Jones Utilities Average (Chart 3) has a excellent track record for leading the Dow Jones Industrial Average and especially at market peaks. Utilities, like financials, are highly leveraged to interest rates. Over the past 60 years, the Dow Utilities Average has lead the DJ Industrials in 7 out of 9 major tops. With the other two times, it moved with the Industrials once and lagged once.
Presently, this average has advanced to a new high. Technical data from the main trading cycle (lower portion of Chart 3) indicates a rising pattern in May. Currently the Dow Jones Utilities Average is displaying no signs of weakness as it moves into summer.
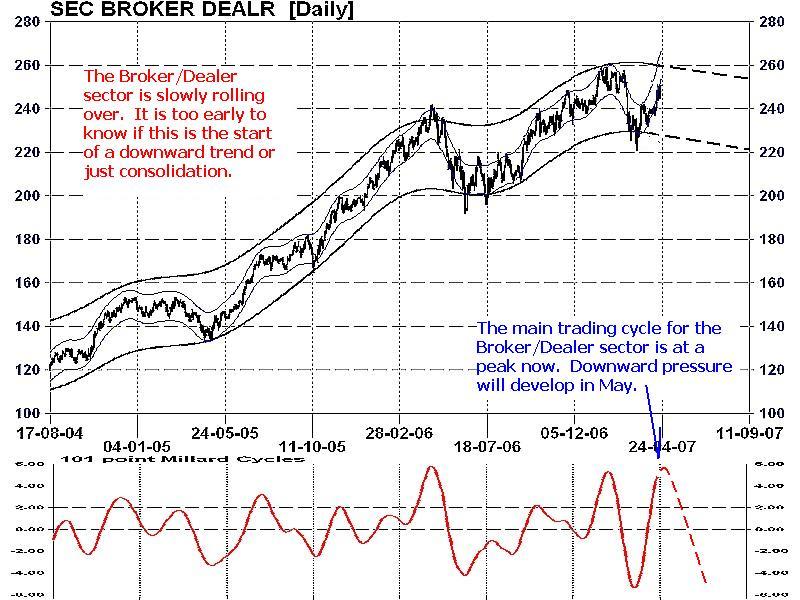
In Chart 4 of the Broker/Dealer sector, this group, after having a healthy run up in 2006 and 2007, now appears ready to consolidate in May and June. Key support for this group is at 220. If the Broker/Dealer index were to fall below this line, then the primary trend will have changed from up to down. The importance of this sector is that it displays whether corporations are optimistic or pessimistic about the future economy. Organizations are more willing to float new IPOs (initial public offerings) when they feel the near-term economy is buoyant and expanding. Broker/Dealers profit from this enthusiasm by structuring and underwriting the new offer. This group sometimes leads the general stock markets but it also often moves in conjunction with the averages.
MY CONCLUSION: Chart 1-3 all remain positive with additional growth anticipated moving into the summer months. Chart 4 of the Broker/Dealer sector remains flat which is neither negative nor positive. A decline through the 220 support level would cause some concern, but current levels only call for a watch and wait approach.
More analysis about the stock markets future trading direction is available in the April newsletter. Go to www.technicalspeculator.com and click on member login.
Your comments are always welcomed.
By Donald W. Dony, FCSI, MFTA
www.technicalspeculator.com
COPYRIGHT © 2007 Donald W. Dony
Donald W. Dony, FCSI, MFTA has been in the investment profession for over 20 years, first as a stock broker in the mid 1980's and then as the principal of D. W. Dony and Associates Inc., a financial consulting firm to present. He is the editor and publisher of the Technical Speculator, a monthly international investment newsletter, which specializes in major world equity markets, currencies, bonds and interest rates as well as the precious metals markets.
Donald is also an instructor for the Canadian Securities Institute (CSI). He is often called upon to design technical analysis training programs and to provide teaching to industry professionals on technical analysis at many of Canada's leading brokerage firms. He is a respected specialist in the area of intermarket and cycle analysis and a frequent speaker at investment conferences.
Mr. Dony is a member of the Canadian Society of Technical Analysts (CSTA) and the International Federation of Technical Analysts (IFTA).
© 2005-2022 http://www.MarketOracle.co.uk - The Market Oracle is a FREE Daily Financial Markets Analysis & Forecasting online publication.