


Commodities Market Wrap - Gold, Silver, Crude Oil and Mining Stocks
Commodities / Gold & Silver Apr 23, 2007 - 06:11 PM GMTBy: Douglas_V_Gnazzo
 Oil
Oil
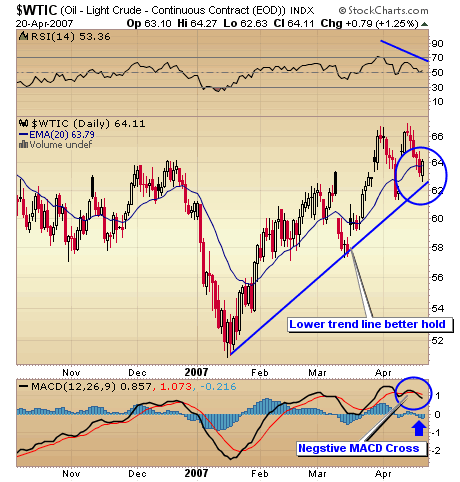
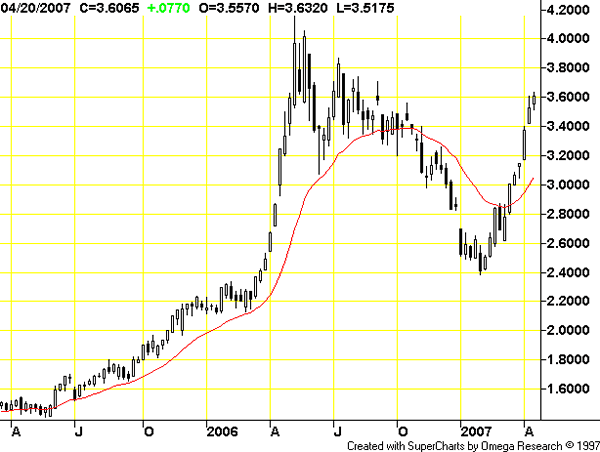
June crude lost $2.22 to $64.11. May gasoline was down 1.9% and Natural Gas fell 5.4%. As the chart below shows, crude is at a critical stage - it either rallies up from here to hold support, or it breaks through support and starts a new leg down.
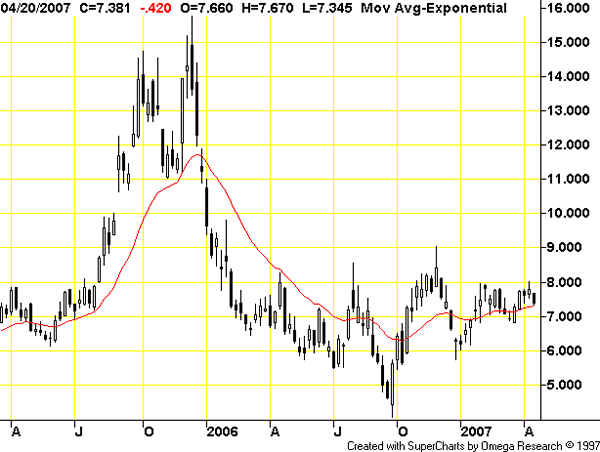
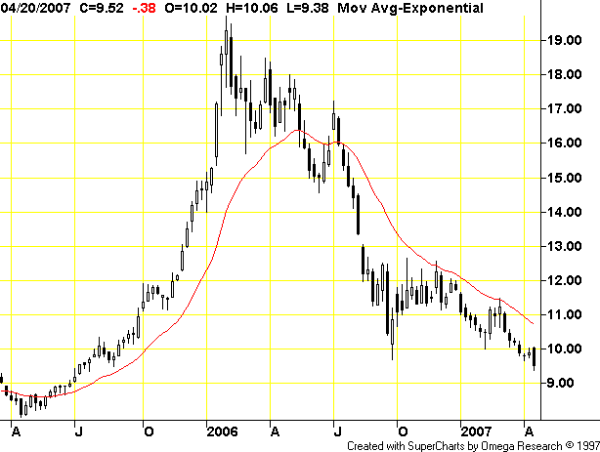
The above chart clearly shows the devastating fall that natural gas took right after 911. All the predictions were for much higher gas and oil prices. So, what did gas do - it dropped over 60%.
Commodities
The CRB index was down 1.8% for the week. As we have said and shown many times, the CRB is not the best of indexes for judging the overall commodity sector. It is a weighted index that is heavily tilted towards energy.
There are many different commodities. On any given day - some are up, and some are down. Furthermore, some are in bull markets and some are in bear markets. To use the CRB to determine the strength or weakness of the commodity market is a fool's game.
Below are some charts that show these different realities.
Copper
Platinum
Sugar
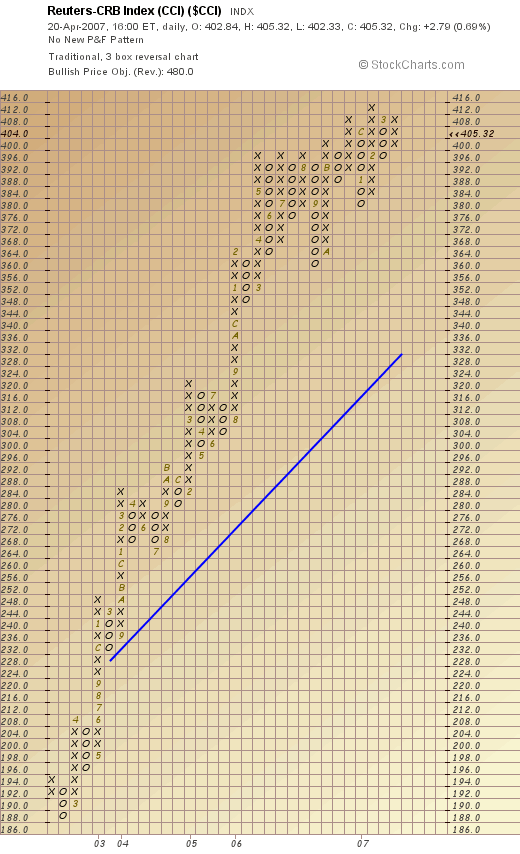
Next is the point and figure chart for the CCI Index - an unweighted index of commodities.

Kuwait readies for possible US-Iran War
Silver
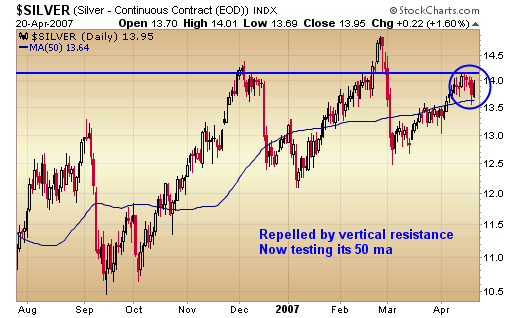
Silver was down 1.0% for the week, closing at $13.95. Silver has not yet closed above its Feb. highs, and has been somewhat weaker then gold as of late. Yet certain silver stocks have been the best performers in the precious market arena.
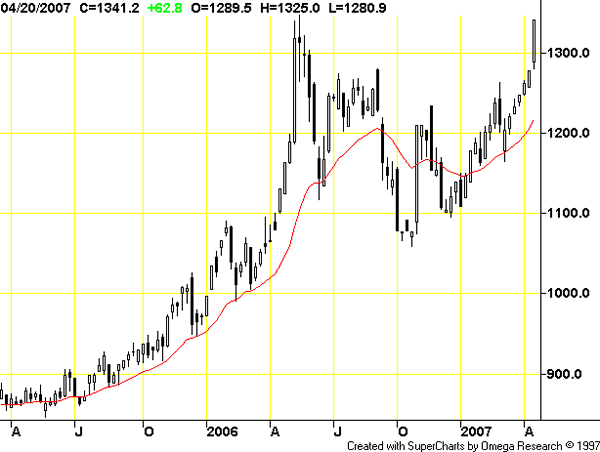
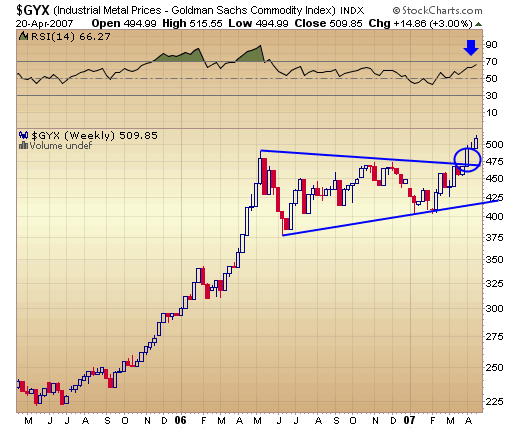
The industrial metals have just broken above their upper trend line.

Nimitz Readies for Duty
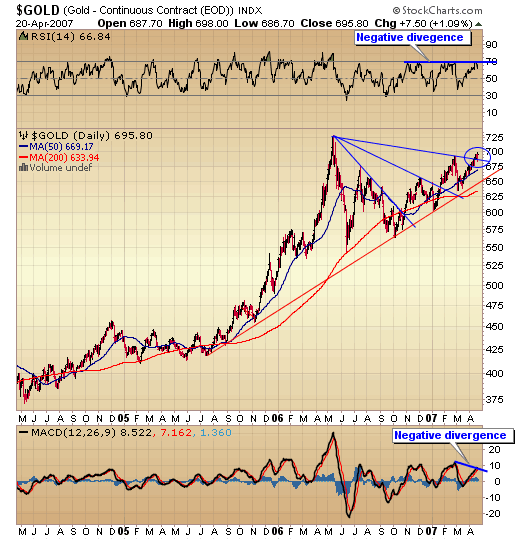
Gold
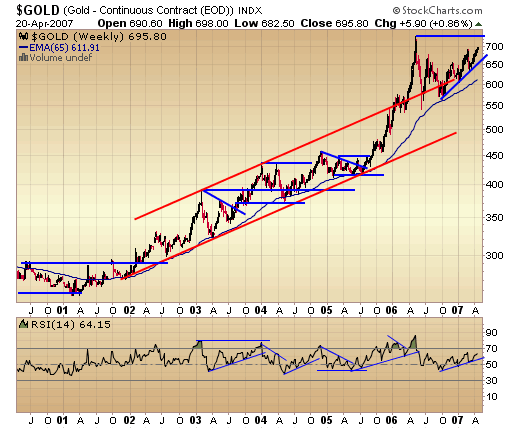
Gold was up $5.90 for the week, closing at $695.80 and within spitting distance of its 25+ year high. It closed above its February high this week, but has yet to test or surpass the May 2006 high near $722.
The daily chart of gold below shows it just peaking above its upper trend line. Notice the negative divergence on the chart per the RSI indicator and the MACD indicator.
The POG needs to do some work to turn these indicators up.
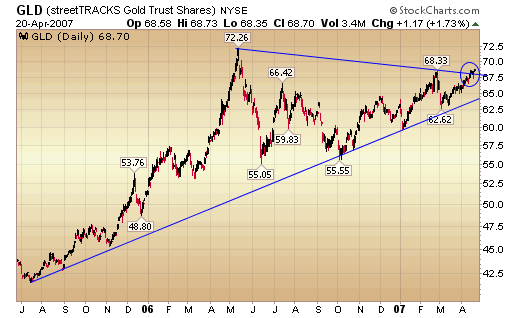
Next is the daily price chart for GLD - the gold ETF or exchange traded fund. It too has just peaked above its upper trend line and has its sites set on the May 2006 high. Time will shortly tell.
Below is the weekly chart of gold going all the way back to the start of the gold bull market. We have listed this for several reasons, which will become self-evident as we proceed further along.
Note the four (4) "stages" in the price action, as well as in the RSI indicator at the bottom of the chart.
HUI Gold Stock Index
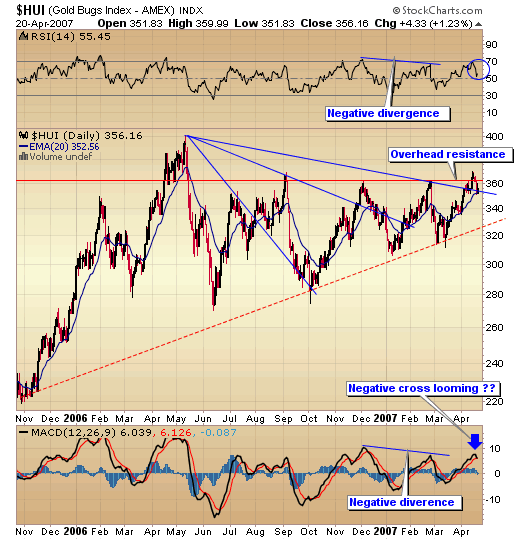
Up first is the daily chart of the Hui Index. For the week the Hui was down 8.31 points to close at 356.15 (-2.28%). As the chart below shows, there are several negative indicators flashing, which need to be turned up into positive territory before a sustainable rally up is possible.
Once again the Hui broke above resistance only to close down back below it. We mentioned that this was quite possible in last week's report. RSI shows negative divergence, as well as turning down sharply; however, it was entering overbought territory.
MACD shows a negative divergence with a negative cross over looming as a distinct possibility. These indicators all need some work to turn them up and positive.
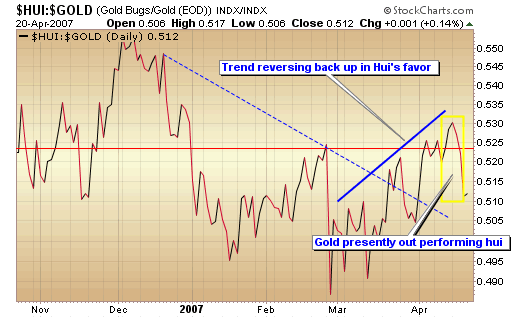
Next we have the chart of the Hui/Gold Ratio. This compares the performance of the gold stocks to the performance of physical gold. A sign of a strong gold bull market is when both the gold stocks and physical gold are headed up, with the gold stocks rising more - generally at a 3 to 1 ratio to physical gold.
The chart shows that beginning in March the gold shares were out performing physical gold. Note, however, the change in the chart in April outlined in yellow. During this time physical gold has been outperforming the stocks. Obviously, it remains to be seen how this pans out.
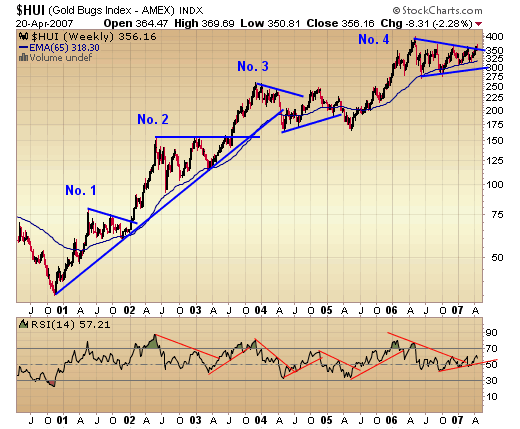
Now we come to le piece de resistance - the Hui Index weekly chart going back to the beginning of the gold bull. This is why we presented a chart of physical gold going back to the start of the bull market at the beginning of the pm section, as the price action of gold is the main determinant of the price action of the gold stocks.
As stated earlier, the HUI Index broke above its December and February highs this past week, but still remains below its May 2006 high of 401.69. Recent price action strongly suggests that the index is going to at least test the May high.
The $64 dollar question is whether the index is going to break out above the new high, and start the next leg up in the gold bull, or if it is just going to test the high and fall back and regroup (or even experience a further correction) before starting the next leg up.
Obviously no one definitively knows the answer to this question. The best one can do is to be aware of the possibilites and the highest probabilities that may occur. To help try to determine that we have gone back and looked at the entire gold bull market to date. We have referenced this chart a few times in the past. It shows the entire bull market in the Hui Index, with the 4 various "stages" delineated.
As the chart clearly shows, each time a new high was reached the market would then correct to an initital low. It would then rally back up and test the high. Subsequently it would once again fall and test the recent low. From there it would finally begin its assault on the next leg up to new highs and the next plateau. A series of higher lows and higher highs was always kept intact.
If you note - this sequence of price action (high/low-retest high/retest low-new highs) was repeated in ALL the stages of the gold bull to date. Does this mean that they are guaranteed to repeat again - NO ? However, the probability is present.
Also worth noting is that as the gold bull has progressed, EACH correction/consolidation has taken longer in TIME to complete. So, for those who bemoan the length of time of this correction - it is to be expected.
Based on the above evidence, we are leaning toward a retest of the May 2006 high within the next few weeks, followed by a retest of the recent lows - with a higher low kept intact. We are leaning this way because it follows the course of the previous bull market corrections, however, this does NOT mean it must or will occur in this precise manner.
Also, many of the charts show divergences and negative cross overs, which need to be repaired and turned up. Most players in the precious metals sector are looking for the next leg up to be commencing, which very well may be occurring. However, we will go with discretion being the better part of valor.
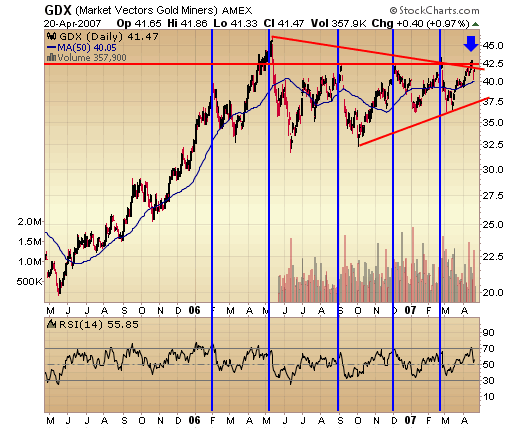
The market vectors gold miners' index below shows the index just poking its head above the upper trend line. There is stiff overhead resistance in this area, but once it gets worked off the breakout should be quite strong. The index has rallied to this point several times and then backed off. This indicates that a lot of overhead supply existed, and that a lot of it has been worked off.
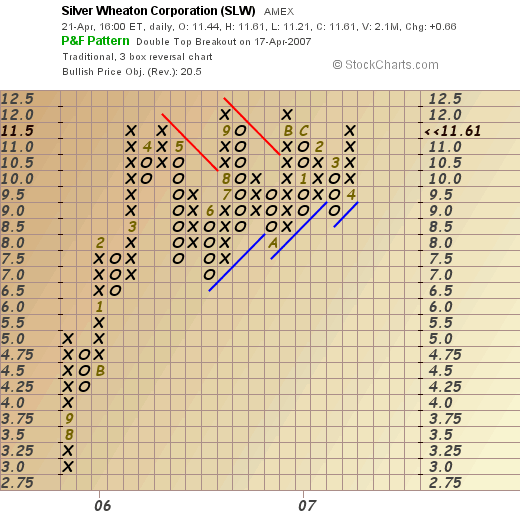
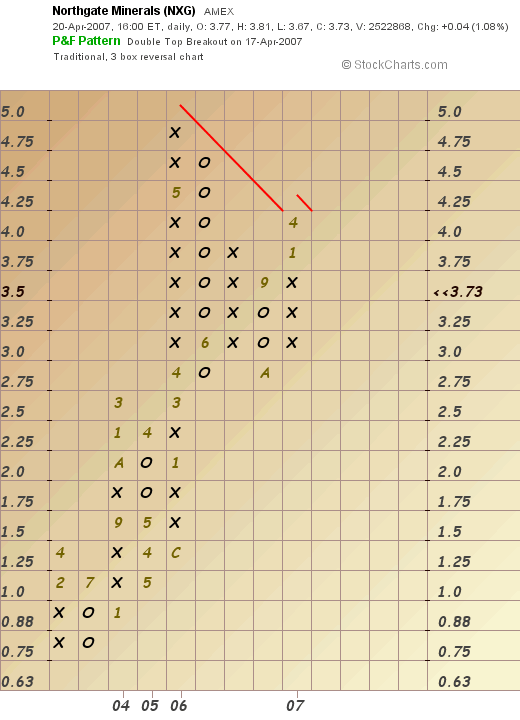
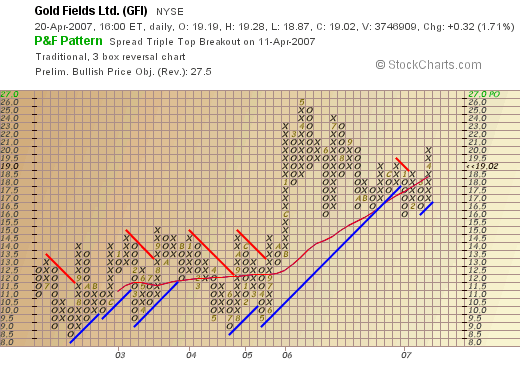
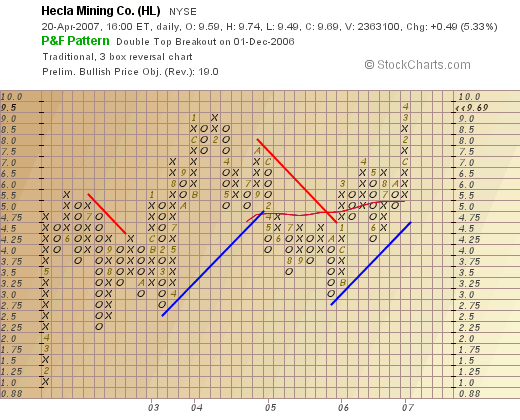
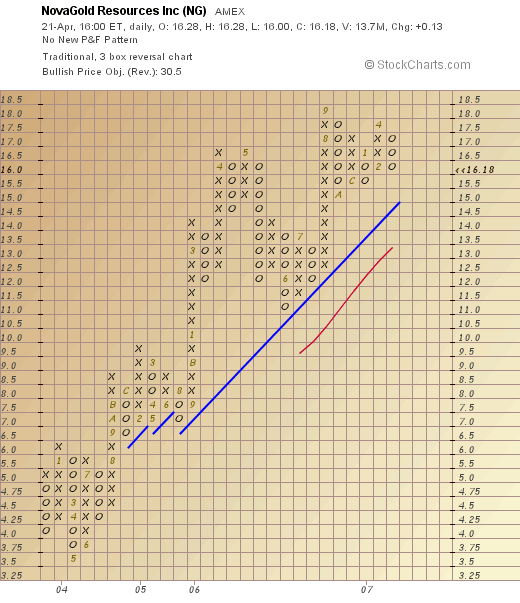
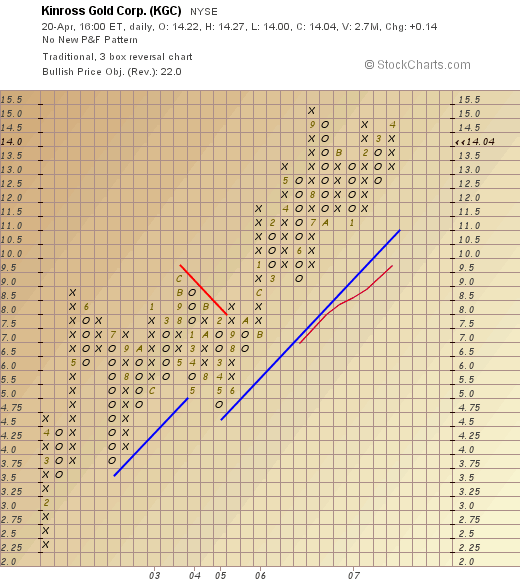
Individual PM Stocks
Following are several gold and silver stocks that we either own or are planning on taking a position in. We will not provide any comment, as the charts are self-explanatory. Caveat Emptor.
Summary
Oil is at an important juncture - either it breaks out with a new leg up, or it will break down with a new leg down. It will decide very soon which way it goes. The overall commodity market is doing fine, with the metals being one of the strongest sectors.
The total market capitalization of the US stock market is approximately $15 Trillion. The market cap of all Gold & Silver stocks is under $200 billion. Do the math.
At this time we favor a test of the May 2006 gold stock highs with a subsequent test of the lows - followed by a new leg up of the gold bull market. This is just one of many scenarios that could occur.
Other probable courses are that the Hui keeps going from here and tests and breaks through the old highs and keeps rising. Another is that the Hui goes down from here and then moves back up to test and or surpass the May 2006 highs.
We are watching and waiting for a good entry point to accumulate further positions. Depending on how the price action unfolds, we may also book profits that accrue.
By Douglas V. GnazzoHonest Money Gold & Silver Report
Douglas V. Gnazzo is the retired CEO of New England Renovation LLC, a historical restoration contractor that specialized in the restoration of older buildings and vintage historic landmarks. Mr. Gnazzo writes for numerous websites, and his work appears both here and abroad. Just recently, he was honored by being chosen as a Foundation Scholar for the Foundation of Monetary Education (FAME).
Disclaimer: The contents of this article represent the opinions of Douglas V. Gnazzo. Nothing contained herein is intended as investment advice or recommendations for specific investment decisions, and you should not rely on it as such. Douglas V. Gnazzo is not a registered investment advisor. Information and analysis above are derived from sources and using methods believed to be reliable, but Douglas. V. Gnazzo cannot accept responsibility for any trading losses you may incur as a result of your reliance on this analysis and will not be held liable for the consequence of reliance upon any opinion or statement contained herein or any omission. Individuals should consult with their broker and personal financial advisors before engaging in any trading activities. Do your own due diligence regarding personal investment decisions. This article may contain information that is confidential and/or protected by law. The purpose of this article is intended to be used as an educational discussion of the issues involved. Douglas V. Gnazzo is not a lawyer or a legal scholar. Information and analysis derived from the quoted sources are believed to be reliable and are offered in good faith. Only a highly trained and certified and registered legal professional should be regarded as an authority on the issues involved; and all those seeking such an authoritative opinion should do their own due diligence and seek out the advice of a legal professional. Lastly, Douglas V. Gnazzo believes that The United States of America is the greatest country on Earth, but that it can yet become greater. This article is written to help facilitate that greater becoming. God Bless America.
© 2005-2022 http://www.MarketOracle.co.uk - The Market Oracle is a FREE Daily Financial Markets Analysis & Forecasting online publication.