


Farrell's Rule #2 U.S. Stocks Won't Bottom Before 2011, 25% Below End 2008
Stock-Markets / Stocks Bear Market Jan 16, 2009 - 03:46 PM GMTBy: Andrew_Butter

 Farrell's Rule # 2: "Excesses of stock prices above the long-term average are invariably followed by excesses of an equal magnitude below".
So what is the long-term average?
Here's a notion, how about valuing stocks in USA using International Valuation Standards (IVS) instead of using the "Dumb-Ass BIG Surprise Valuation Standards" (DABSVS) which are so much in vogue these days?
By definition a valuation of stocks done over 50 years, if it was done properly, would deliver the long-term average, because also by definition, over a long period of time, everything is valued properly, on average, by the market.
By way of explanation, International Valuation Standards were devised by a group of valuation institutes led by the US and UK valuation institutes, so that the stupidity and SURPRISE of the Asian Crisis would not be repeated. The first edition was published in 2000 and these standards are accepted by practically every valuation institute in the world (including the one in France ...imagine!!).
Of course IVS have never been implemented or recognized by governments, bean counters, economists, or banking regulators, because it would not be politically expedient for investors to actually know what the real value of assets actually is. And it would certainly not be expedient for taxpayers and voters to know what the real value of the liabilities that their chosen representatives have run up on their behalf!
Imagine...such blasphemy might expose highly respected public figures to the suggestion that they are Dumb-Asses!! One can't have that, after-all what is most important to a politician, (a) appearances, or (b) the economic viability of the country they represent?
No contest there - appearances wins hands down every day.
What's the difference between IVS and DABSVS?
The difference is that DABSVS say that there are only two ways to value an asset (1) Book Value (based on what some Dumb Ass (allegedly) paid for an asset a long time ago (that of course includes any "commissions" that were paid)) and (2) Mark-to-Market which is the price that some random Dumb-Ass might have paid yesterday (also includes "commissions").
IVS considers the possibility that in the real world there are a lot of Dumb Asses, and says that whenever there is an epidemic of Dumb Asses (or the evidence of that in the form of manure), then, it's a good idea to do an income capitalization valuation, just as a check.
And in cases where there is a big discrepancy between IVS and DABSVS a prudent investor would be well advised to consider using the income capitalization value rather than the DABS value (if he doesn't like surprises of the trillion dollar variety).
Income capitalization Valuation of S&P 500
The total stock market capitalization is a measure of the profit margin made on the total economic value-adding capacity in the country, multiplied by a market-derived yield. If over a long time this margin is constant, then it follows that market capitalization would reflects the sum of economic activity (GDP in nominal prices) multiplied by a yield, which reflects the cost of money (long-term interest rates (LTIR)).
So, over a long time, one would expect a plot of GDP x 1/LTIR would correlate with the total market cap of a country, which for expediency (since no one, neither the government, nor the NYSE nor the NASDAQ publishes a time series of market cap), I used the average stock market price....like they say "good enough for government work".
Here is a "BIG SURPRISE"...it does!!!
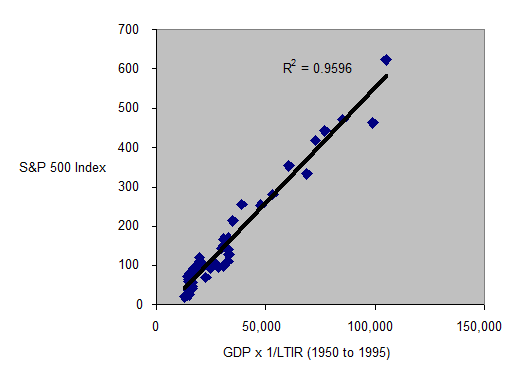
Well at least for the data from 1950 to 1995, which is before the Dumb-Asses really managed to get a corner on the "market" (I use apostrophes because if a market is being manipulated by Dumb Asses then until they run out of money, it's really NOT a market in the true sense of the word).
The Regression coefficient of the line is 95.9% which means that over a long period of time (45 years is a long period of time), 95.9% of changes in the S&P 500 can be explained by changes in GDP x 1/LTIR.
By the way, the Standard Deviation of the "model for the S&P 500 Index" compared to actual for this period is 26% so that means that for 10% of the time the difference between the model, and the "actual" could be 50% (two standard deviations). What that says in plain English is that Dumb Asses weren't invented yesterday. I suspect that if I had compared actual market cap of USA the Standard Deviation would have been less.
(Also by the way I used the end of year high for the S&P 500 and the previous one year's GDP in the model).
Anyway, good enough for government work!
Dumb Ass Cycles
If this analysis is valid (hard to argue against a 96% R-Squared of two simple timelines and International Valuation Standards), then the deviation between the "valuation" (i.e. the model) and the actual is a measure of the influence that (collectively) Dumb Asses have on the market, which I shall call the "Dumb Ass Index"; where:
The Dumb Ass Index = 1- (S&P 500 /(GDP (nominal)/(1/LTIR)))
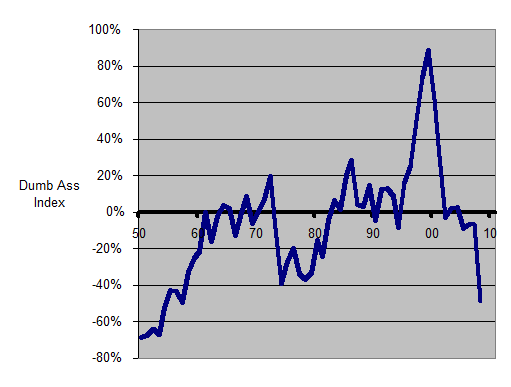
Plotting the Dumb Ass Index over time allows a review of Farrell's Rule since by definition the model delivers the "Long Term Average":
Just a note, looking at the chart I reckon that if the market cap of US stocks had been used then from 1950 to 1980 or so the line would have shifted a bit, because the amount of economic activity represented by stocks increased over this period. Perhaps some 24 year-old economics PhD student can spend the next twenty years studying that point?
Anyway, to NOW:
My take on the chart is that what happened starting in about 1995 there was a "bubble" in the stock market (caused mainly by Dumb Asses doing what they do best), which peaked in 1999, at which point stocks were 80% over priced.
Then there was a fall down to the equilibrium line, but this was arrested by the "brave efforts" of Dr. Greenspan, so things just bumbled along for a while. But at a cost, because in the real world a dose of "irrational exuberance" must inevitably be followed by a hangover, with the pain of the hangover being exactly equal to the amount of the previous exuberance (Farrell's Rule).
Well OK we had the "hair of the dog" thanks to Dr. Greenspan, that got us through most of the day, but then our liver blew up and WOW!!!
THE GOOD NEWS
The Good News is that right now by this analysis the S&P 500 is 49% under-priced compared to the long-term average.
THE BAD NEWS
If Farrell's Rule holds the market won't turn until the S&P 500 is about 80% below the long-term average, and it could take a year, perhaps two for that to happen.
The VERY BAD NEWS is that according to Nouriel Roubini 2009 will deliver a -5.4% rate of nominal economic growth.
In which case there is at least 25% more to be shaved off the S&P 500 (and presumably other stocks) before the market turns back.
Aghh...!!...Goodness Gracious, what to do, what to DO?
As my friend Ambrish says in perfect and beautifully modulated Hinglish whenever he gets it caught in his fly.
Well for a start, it might be a good idea to dump DABSVS and mandate that everyone (yes governments, bean counters and economists too) start using International Valuation Standards.
Then at least we would know where we are for a change. A valuation is like a reference grid on a map, get those wrong and you can end up going around in circles. LIKE NOW!
By Andrew Butter
Andrew Butter is managing partner of ABMC, an investment advisory firm, based in Dubai ( hbutter@eim.ae ), that he setup in 1999, and is has been involved advising on large scale real estate investments, mainly in Dubai.
Copyright © 2009 Andrew Butter
Andrew Butter Archive |
© 2005-2022 http://www.MarketOracle.co.uk - The Market Oracle is a FREE Daily Financial Markets Analysis & Forecasting online publication.