


Credit Crisis Contraction Gaining Positive Traction
Interest-Rates / Credit Crisis 2009 Jan 14, 2009 - 04:58 PM GMT

 In order to gauge the progress being made to unclog credit markets and restore confidence in the world's financial system, I monitor a range of financial spreads and other measures. By perusing these, as summarized in this “Credit Crisis Watch” review, one can ascertain to what extent the various central bank liquidity facilities and capital injections are having the desired effect.
First up is the LIBOR rate. This is the interest rate that banks charge each other for one-month, three-month, six-month and one-year loans. LIBOR is an acronym for “London InterBank Offered Rate” and is the rate charged by London banks. This rate is then published and used as the benchmark for bank rates around the world.
After having peaked on October 10 at 4.82%, the three-month dollar LIBOR rate declined sharply to 1.09%. LIBOR is therefore trading at 84 basis points above the upper band of the Fed's target range - a great improvement, but still steep compared to an average of 12 basis points in the year before the start of the credit crisis in August 2007.
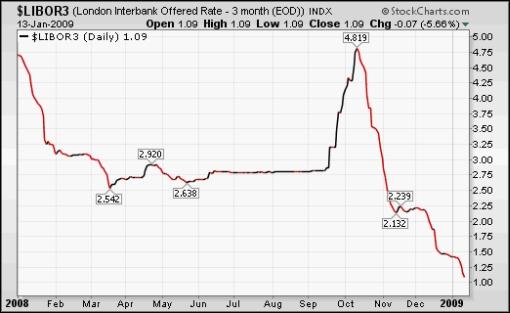
Source: StockCharts.com
Importantly, US three-month Treasury Bills have started making their way higher to 0.12% after momentarily trading in negative territory in December as nervous investors were in desperate search of safety.
US three-month Treasury Bill yield
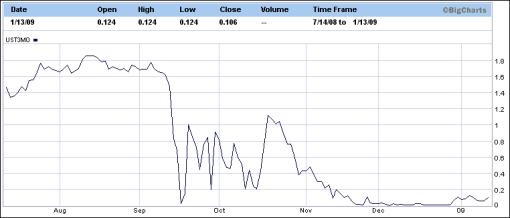
Source: The Wall Street Journal
The TED spread (i.e. three-month dollar LIBOR less three-month Treasury Bills) is a measure of perceived credit risk in the economy. This is because T-bills are considered risk-free while LIBOR reflects the credit risk of lending to commercial banks. An increase in the TED spread is a sign that lenders believe the risk of default on interbank loans (also known as counterparty risk) is increasing. On the other hand, when the risk of bank defaults is considered to be decreasing, the TED spread narrows.
Since the TED spread's peak of 4.65% on October 10, the measure has eased to a five-month low 0.97% - well above the 38-point spread it averaged during the twelve months prior to the start of the crisis, but nevertheless a strong move in the right direction.
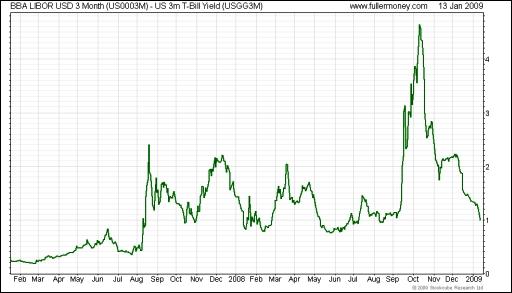
Source: Fullermoney
The difference between the LIBOR rate and the overnight index swap (OIS) rate is another measure of credit market stress.
When the LIBOR-OIS spread increases, it indicates that banks believe the other banks they are lending to have a higher risk of defaulting on the loans, so they charge a higher interest rate to offset that risk. The opposite applies to a narrowing LIBOR-OIS spread.
Similar to the TED spread, the narrowing in the LIBOR-OIS spread since October is also a move in the right direction.
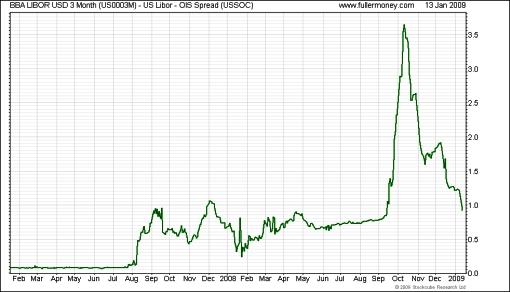
Source: Fullermoney
Despite the interbank lending rates having declined from their peaks, banks have significantly curtailed the amount of money they are actually lending. The US Depository Institutions Aggregate Excess Reserves continue their ascent at levels far in excess of the amount that banks need to keep on deposit to meet their reserve requirements (see chart below). This measure indicates that the balance sheets of banks remain under pressure, especially in view of the fact that the value of some assets is not known. As mentioned before, a peak in the Excess Reserves graph should coincide with a turning point in the recovery of banks.
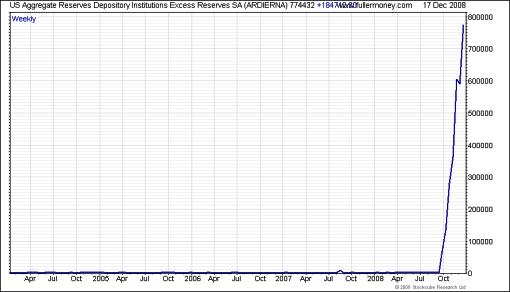
Source: Fullermoney
Not illustrated by a chart, the spreads between ten-year Fannie Mae and other Government Sponsored Enterprise (GSE) bonds and ten-year US Treasury Notes have also tightened significantly over the past few weeks.
The national average rates for a US 30-year fixed mortgage yesterday declined to 5.08% from 5.33% a week ago and 6.46% in October last year. However, the rate is still 399 basis points higher than the three-month dollar LIBOR rate. According to Bloomberg , this spread averaged 97 basis points during the 12 months preceding the crisis, indicating that lower rates are not being passed on to consumers.
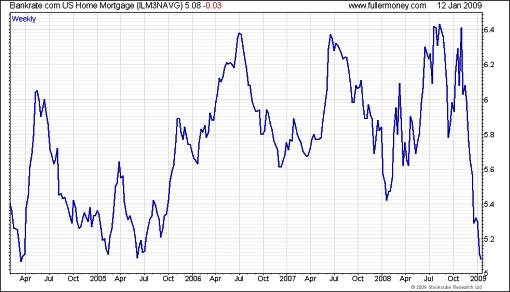
Source: Fullermoney
As far as commercial paper is concerned, the A2/P2 spread measures the difference between A2/P2 (low quality) and AA (high quality) 30-day non-financial commercial paper. The spread has declined markedly to 2.23% from almost 5% at the end of December.
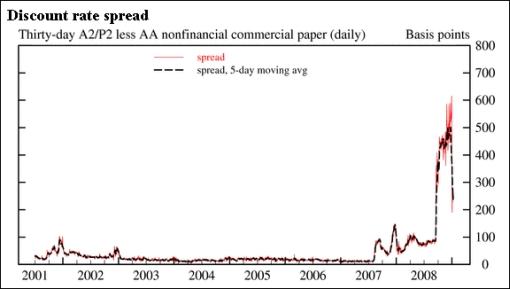
Source: Federal Reserve Release - Commercial Paper
Similarly, junk bond yields have also declined, as shown by the Merrill Lynch US High Yield Index. The Index dropped by 22.9% to 1,682 from its record high of 2,182 on December 15. This means the spread between high-yield debt and comparable US Treasuries was 1,682 basis points by the close of business on Tuesday. With the US 10-year Treasury Note yield at 2.32%, high-yield borrowers have to pay 19.12% per year to borrow money for a ten-year period. At these exorbitant rates it is extremely difficult for companies with a less-than-perfect credit status to conduct business profitably.
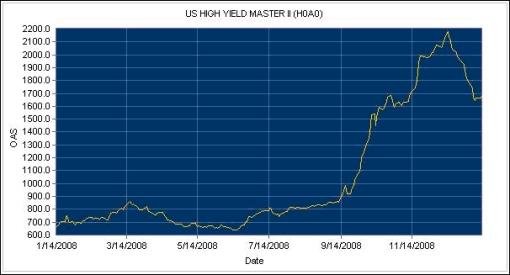
Source: Merrill Lynch Global Index System
The excellent gains of the iBoxx Investment Grade Corporate Bond Fund (LQD) (+25.8%) and High Yield Corporate Bond Fund (HYG) (+23.1%) since their October/November lows, provide more evidence that the credit markets are moving in the right direction. However, from a short-term technical point of view, the rallies seem overdone and pullbacks will not come as a surprise.
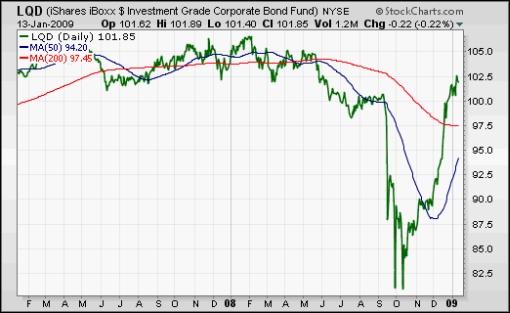
Source: StockCharts.com
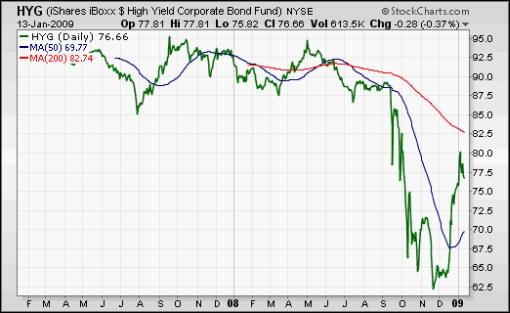
Source: StockCharts.com
Another indicator worth monitoring is the Barron's Confidence Index. This Index is calculated by dividing the average yield on high-grade bonds by the average yield on intermediate-grade bonds. The discrepancy between the yields is indicative of investor confidence. There has been an up-tick in the ratio since its all-time low in December, showing bond investors are growing a little more confident and have started opting for more speculative bonds over high-grade bonds.
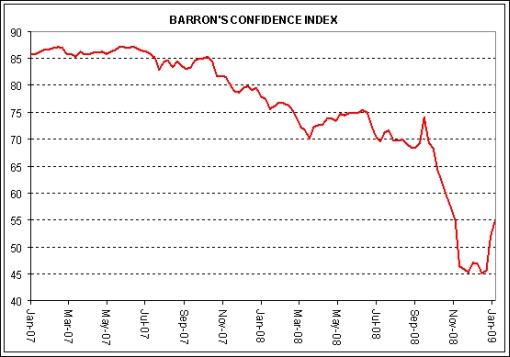
Source: I-Net Bridge
Deutsche Bank reports that the implied default rates on corporate bonds are at an extreme level, but that it is not inconceivable that especially high-yield bonds could see defaults remaining high for long enough to see a cumulative five-year default figure above the 30% to 35% range of the early 1990s and early part of this decade. “… the chances are far higher of such an occurrence than seeing the investment-grade cumulative five-year rate climbing into double digits,” the bank said.
According to Markit , the cost of buying credit insurance for European, Japanese and other Asian companies has shown a further improvement since the previous “ Credit Crisis Watch ” of three weeks ago, as shown by the tighter spreads (expressed in basis points) for the five-year credit derivative indices listed in the table below.
The notable exception has been the US where the CDX Investment Grade Index and the CDX High Yield Index both edged up. The increase of 29 basis points in the High Yield spread means an increased cost of $29,000 (up from $1,233,000 to $1,262,000) to insure $10 million of debt annually over five years.
• CDX (North America, investment-grade) Index: up from 211 to 218
• CDX (North America, high-yield) Index: up from 1,233 to 1,262
• Markit iTraxx Europe Index: down from 181 to 169
• Markit iTraxx Europe Crossover Index: down from 1,008 to 978
• Markit iTraxx Japan Index: down from 295 to 291
• Markit iTraxx Asia ex Japan IG Index: down from 347 to 307
• Markit iTraxx Asia ex Japan HY Index: down from 1,263 to 1,132
The graphs of the CDX indices are shown below, with the red line indicating the spreads easing over the past month.
CDX (North America, investment-grade) Index
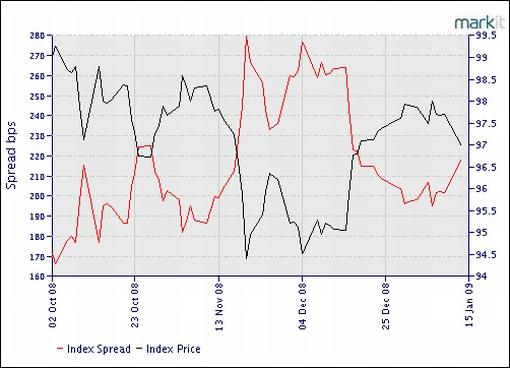
Source: Markit
CDX (North America, high-yield BB) Index
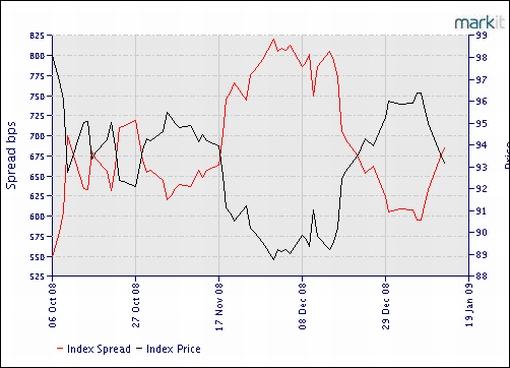
Source: Markit
As far as the outlook for the credit derivative indices are concerned, Markit said: “Optimists have been declaring that all of the bad news has been priced into spreads, and we are set for a lengthy rally. The implausible default rates implied by current spread levels give this theory a measure of support. But the coming weeks are likely to see a torrent of negative news, and it is improbable that the CDS market can continue its stoic resistance. The upcoming US earnings season will be key, as will the progress of Obama's fiscal stimulus package through Congress. We have already seen several defaults this year, and we are sure to see many more in the coming months.”
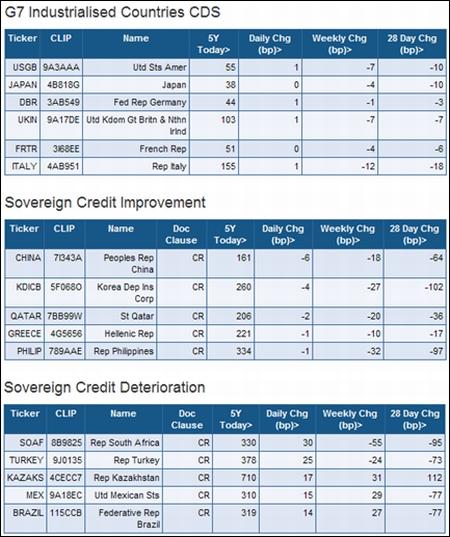
Lastly, the tables below show some country CDS statistics, again courtesy of Markit . These prices represent the cost per year to insure $10,000 of debt for five years. For example, Italy is in most trouble among the G7 countries with a cost of $155 per year to insure $10,000 of debt.
It is noteworthy that Germany, Japan and France at the moment all have a lower default risk that the US. It now costs $55 per year to insure $10,000 against US default for the next five years. Although this is down from $65 a month ago, the corresponding numbers were $8 early last year and $36 in November. As in the case of the US, UK CDS spreads are also trading close to record levels as unease over the level of national debt takes its toll on their sovereign credit risk.
Not shown in the table, three of the weaker members of the eurozone (Spain, Ireland and Greece) yesterday saw their CDSs come under renewed pressure following negative rating agency action. Spain's spread widened by 13 basis points to 112 basis points, whereas Ireland and Greece are trading at the widest levels of any eurozone member.
The past few weeks saw steady progress on the credit front, with the TED spread, LIBOR-OIS spread and GSE mortgage spreads having narrowed markedly since the record highs, although spreads are still elevated compared to pre-crisis levels. More recently, corporate bonds have also seen a strong improvement, but high-yield spreads remain at distressed levels.
Furthermore, the CDX and iTraxx credit derivative indices have mostly shown a solid improvement since the peaks in November. And even US Treasury Bills have started edging up from panic levels.
Action taken by the Fed and other central bank has resulted in ongoing progress being made to fix the broken credit machine. Although the credit markets are gaining some positive traction, interbank lending has not really picked up and the financial system is still fragile. In short, the thawing of the credit markets has a way to go before liquidity starts to move freely and the world's financial system functions normally again. The Fed's Senior Loan Officer Opinion Survey will provide a useful update on credit conditions when it becomes available on February 2.
Did you enjoy this post? If so, click here to subscribe to updates to Investment Postcards from Cape Town by e-mail.
By Dr Prieur du Plessis
Dr Prieur du Plessis is an investment professional with 25 years' experience in investment research and portfolio management.
More than 1200 of his articles on investment-related topics have been published in various regular newspaper, journal and Internet columns (including his blog, Investment Postcards from Cape Town : www.investmentpostcards.com ). He has also published a book, Financial Basics: Investment.
Prieur is chairman and principal shareholder of South African-based Plexus Asset Management , which he founded in 1995. The group conducts investment management, investment consulting, private equity and real estate activities in South Africa and other African countries.
Plexus is the South African partner of John Mauldin , Dallas-based author of the popular Thoughts from the Frontline newsletter, and also has an exclusive licensing agreement with California-based Research Affiliates for managing and distributing its enhanced Fundamental Index™ methodology in the Pan-African area.
Prieur is 53 years old and live with his wife, television producer and presenter Isabel Verwey, and two children in Cape Town , South Africa . His leisure activities include long-distance running, traveling, reading and motor-cycling.
Copyright © 2009 by Prieur du Plessis - All rights reserved.
Disclaimer: The above is a matter of opinion and is not intended as investment advice. Information and analysis above are derived from sources and utilizing methods believed reliable, but we cannot accept responsibility for any trading losses you may incur as a result of this analysis. Do your own due diligence.
Prieur du Plessis Archive |
© 2005-2022 http://www.MarketOracle.co.uk - The Market Oracle is a FREE Daily Financial Markets Analysis & Forecasting online publication.