


Weekly Gold and Silver Technical Analysis Report - Potential Double Top
Commodities / Gold & Silver Apr 22, 2007 - 01:38 PM GMTBy: Merv_Burak

Lots of speculation about the next great gold boom – or not ? My Composite Index of Precious Metals Indices shows a serious double top. Let's hope it's just a short term aberration.
COMPOSITE INDEX of PRECIOUS METALS INDICES
At the end of most of these commentaries you will find a table of Precious Metals Indices. The table includes the major North American precious metals Indices, the various FTSE Gold Mines Indices, the seven Merv's Indices as well as gold, silver and the US$. Subscribers to my weekly precious metals service get the full expanded table along with a weekly Composite Index chart that shows the average weekly performance of all of these Indices. This week the chart may be giving a very serious warning so I thought I'd show it to all my commentary readers.
The chart has two interesting features. First is the potential double top pattern and the second is the negative divergence between the indicator (MACD) and the Index. Both of these are bearish warnings at this time. I don't plan to go into any detailed analysis of these features but will provide just a few quickie comments.
A double top is only a double top after the fact. Until then it is only a “potential”. For this to be a validated double top the Index would have to drop below the lows of last October. That is a long way of. This week we see the Index reacting lower from the double top high. That may or may not continue, only time will tell. One should, however, be on guard for a reversal of trend but no need to panic yet.
As for the negative divergence in the indicator, this too is just a warning. All of my price momentum indicators are giving me a similar picture to that of the MACD. What this is telling us is that at this period in time the strength of the recent upside Index action has not been nearly as strong as what it was in early 2006. The Index may still go a lot higher, it often does in this weakened condition but the odds are that there is a top ahead whereby the weakened Index will not be able to over come – UNLESS the Index gets a second wind and sails to new highs on improving strength. Again, one should be on guard for a reversal but not to panic yet.
GOLD : LONG TERM
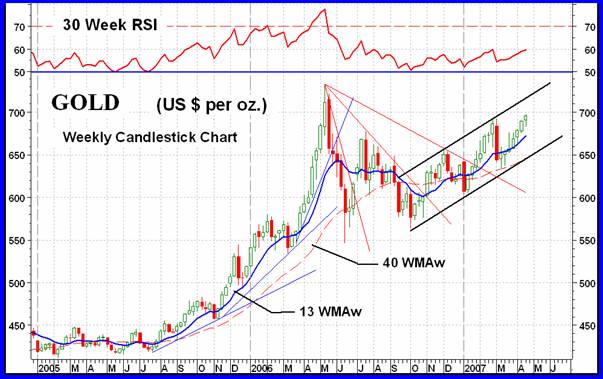
Nothing has changed in the long term P&F chart from last week so I'll forgo any P&F commentary this week.
Charts are always interesting to a technician, some more so than others. The long term (weekly) chart of gold is one such interesting chart. In these commentaries I try to occasionally present some technical guidance for the readers to hopefully make them more technically savvy. A little education is always good for the sole. Today – about as little as one can get away with.
Long time readers may recognize two of my FAN PRINCIPLE sets of trend lines at work. We have what I call an accelerating bearish FAN trend lines (blue) ending with the “blow-off” stage in early 2006 and a decelerating bullish FAN trend lines (red) ending with the reversal confirmation in early 2007. With the blow-off reversal confirmed in May of 2006 at about $655 one might have expected a longer bear trend but these blow-offs are not necessarily a signal to a new bear market but sometimes a signal that we had gone just too far, too fast and it was time to take a breather before continuing. As for the bullish FAN, the criteria here is that the breaking of the second FAN trend line is the reversal signal while the breaking of the third is the final confirmation. So far, so good.
Mentioned in the past has been the channel that the price of gold has been trapped inside since October 2006. This is shown. Gold is not expected to move out of this channel for some time yet.
Comparing the chart for gold versus the Composite chart shown earlier one might wonder how the Composite can be at the level of the May 2006 high while gold and all the major North American Indices are still some distance below their highs. The answer is that the seven Merv's Indices have all exceeded their previous May 2006 highs and some by a goodly percentage (see last week's chart and the one shown this week). This caused the Composite Index to show better performance than gold or the majors.
As for what the normal indicators are telling us as to the present long term position of the market, well despite some short term lateral movement the major trend is still to the up side and continues. The price is well above its positive long term moving average line and the price momentum (strength) remains in the positive zone. As mentioned for the Composite, the momentum is showing weakness versus the price activity (negative divergence) and this continues to be a cause for concern.
All in all there is no need yet to reverse my BULLISH long term position.
INTERMEDIATE TERM
When talking about time periods my general definition of intermediate term is “several weeks to several months” while long term is “more than several months”. Short term may be defined as “several days to several weeks”. The channel shown in the long term chart can be taken as a long term channel. The channel shown in the short term chart below is at a transition point being at the upper end of the short term definition and near the lower end of the intermediate term definition. I would expect this channel to be broken long before the long term one.
Continuing within both channels the recent price action continues to take place above a positive intermediate term moving average line. Price momentum also continues in its positive zone although continuing to display weakness versus the price activity. Although the price is slightly above its previous high of 26 Feb the momentum is still slightly below its previous high of the same period. Another negative divergence. The volume indicator continues to track above its intermediate term trigger line for a positive reading. However, as mentioned last week, the daily volume continues to be at a level lower than the average volume for the past intermediate term period for a negative. We need to see an improvement in the daily volume during upside trading days.
For now I remain BULLISH as far as the intermediate term indicators are concerned.
GOLD : SHORT TERM
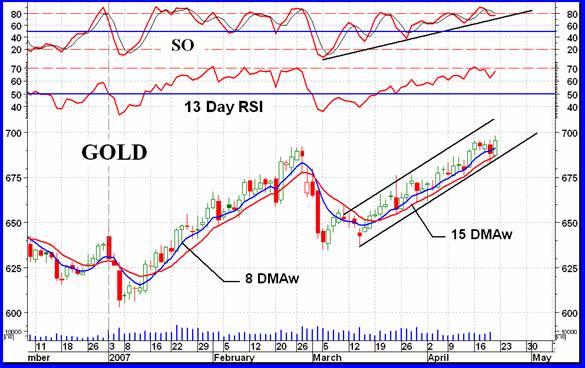
It's been about six weeks now for this trend and it's getting a little old for a short term but still a little young for an intermediate term. These tight trends usually do not last much longer than where we are at right now. However, one must go with the trend in motion until reversed so I am still on the bullish side for this move. The trend continues above its positive short term moving average line (15 DMAw), however, such action is getting closer and closer to the line and a move below the moving average is not to be unexpected. The short term momentum (13 Day RSI) continues in the positive zone but one might visualize the indicator as topping out. So, as long as the action continues above the moving average line and the line remains positive and as long as the action remains inside the channel one should remain bullish, short term wise. I would be inclined to throw in the short term towel if gold closes below $682.50 (June contract).
IMMEDIATE TERM
I'm not really keeping tabs as to how good the flip of the coin is doing here in the immediate term, I'm sure there is someone out there who may be keeping tabs. I suspect that over a long period the flip will come out to the 50/50 split between good calls and bad calls. With the world political situation as it is anyone trying for better than a 50/50 guess on Saturday as to what gold will do on Monday is kidding themselves. However, assuming the political situation will not interfere, very often the aggressive indicators might give one an upper hand at the guess. The price action continues above the very short term moving average line and the Stochastic Oscillator (SO) is in its positive zone, and all is well with the world. We have a well defined up trend in the SO which cannot last much longer before being violated. The turn will then be at hand. For now, more good times look like the best bet for Monday and Tuesday. Watch out if it closes below $688.25.
NORTH AMERICAN GOLD INDICES
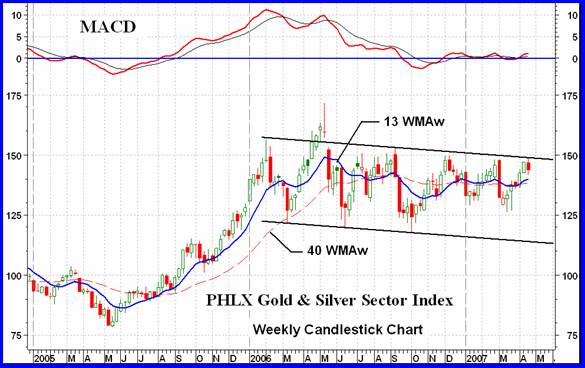
Most of the precious metals industry look to the PHLX Gold & Silver Sector Index as the standard for the industry. Well the standard has not done much in the past year other than slowly head lower. Once more it is reacting lower from the upper channel line, a resistance line. Comparing this Index to the Merv's Qual-Gold Index the action since last October has deviated quite substantially between the two. Both started a rally in October but the rally petered out in the PHLX while it just kept on going in the Qual-Gold Index. There is still nothing in the indicators to give one great enthusiasm for the fortunes of this Index, or the other major Indices.
MERV'S PRECIOUS METALS INDICES
See Index earlier in the commentary. What we see in the Index is a double top potential. This week the Index reacted lower, which might be the start of a further decline leading to a validation of the double top, but that's sometimes in the future. For now the general trend is still towards the up side with a momentum indicator that remains in the positive zone.
MERV'S GOLD & SILVER 160 INDEX
The overall universe of 160 precious metal stocks closed almost at a stand still this past week. Only a small loss of 0.2% was the result. This, as compared to the 2 to 3 % losses for the majors. This minimal loss on the week is not represented by the mass of stocks. A full 57% of the component stocks closed lower while only 39% closed higher. This should have resulted in a greater Index loss but the gainers, mostly speculative and gambling stocks, had good % gains versus the smaller % loss for the losers. The BULLISH overall summary of individual stock ratings mentioned last week decreased in all three time periods this week but still remain in the BULLISH camp. The indicators for the intermediate and long term also changed very little from last week. We are still in the bullish camp for both periods. And finally, there were no stocks in my plus/minus over 30% weekly performance category so speculation is still being checked at a low level.
MERV'S QUAL-GOLD INDEX : MERV'S SPEC-GOLD INDEX : MERV'S GAMB-GOLD INDEX
Once again we have that “higher quality, lower performance” situation this week. The Qual-Gold lost 2.5% on the week about equal to the North American majors. The Spec-Gold lost only 0.8% while the Gamb-Gold was the only winner with a gain of 1.1% on the week. Despite the small losses and gains in the Indices their intermediate and long term positions have not changed from last week. All three Indices are BULLISH for the intermediate and long term but the Qual and Spec-Indices are still giving a momentum cautionary message. The intermediate term Gamb-Gold Index momentum has entered its overbought zone and the long term is very, very close to doing so. The momentum indicator for the Gamb-Gold is still showing a negative divergence versus the Index but the actual momentum numbers are okay.
SILVER
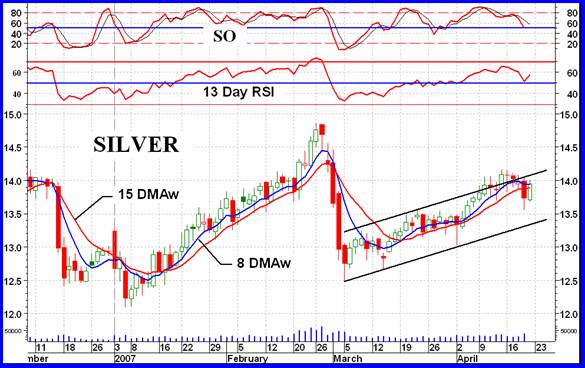
Silver seems to be showing greater weakness than gold is, at least in the past few weeks. One can compare the chart above with the short term gold chart and see the difference. Here, we have violated both short term moving average lines and have turned the very short term one lower. The Stochastic Oscillator is in a definite down trend while the short term RSI is weak but not yet in the negative. It may be time to be giving your silver bullion and stocks a good look over to be sure you are not looking at a surprise ahead. Always be prepared for the unexpected with these metals and stocks.
MERV'S QUAL-SILVER INDEX : MERV'S SPEC-SILVER INDEX
As with the Gold sector Indices these two silver Indices declined slightly on the week with the Qual taking the biggest hit at minus 2.2% while the Spec-Silver ended the week even. The one week decline does nothing to the ratings for these Indices, both Indices are still BULLISH for both time periods. We'll have a better look at them next week is something more serious happens.
MERV'S PRECIOUS METALS INDICES TABLE
That's it for this week.
By Merv Burak,
CMTHudson Aero/Systems Inc.
Technical Information Group
for Merv's Precious Metals Central
Web: www.themarkettraders.com
e-mail: merv@themarkettraders.com
During the day Merv practices his engineering profession as a Consulting Aerospace Engineer. Once the sun goes down and night descends upon the earth Merv dons his other hat as a Chartered Market Technician ( CMT ) and tries to decipher what's going on in the securities markets. As an underground surveyor in the gold mines of Canada 's Northwest Territories in his youth, Merv has a soft spot for the gold industry and has developed several Gold Indices reflecting different aspects of the industry. As a basically lazy individual Merv's driving focus is to KEEP IT SIMPLE .
To find out more about Merv's various Gold Indices and component stocks, please visit www.themarkettraders.com and click on Merv's Precious Metals Central . There you will find samples of the Indices and their component stocks plus other publications of interest to gold investors. While at the themarkettraders.com web site please take the time to check out the new Energy Central site for the most comprehensive survey of energy stocks on the internet.Before you invest, Always check your market timing with a Qualified Professional Market Technician
© 2005-2022 http://www.MarketOracle.co.uk - The Market Oracle is a FREE Daily Financial Markets Analysis & Forecasting online publication.