


Timing the Next Stocks Bull Market
Stock-Markets / Stocks Bull Market Jan 13, 2009 - 03:50 PM GMTBy: Guy_Lerner

 What is it going to take before we see a bottom in stocks leading to a new bull market?
Time.
Time is the only thing that will heal this economy and heal the markets. Until sufficient time has passed, the markets are just treading water. The markets are likely to remain in a range between the November, 2008 lows and 1000 on the S&P500 for a very long time. That is ok as this buys time, which is what the markets need.
The markets have to consolidate in this range before they can move higher, and the only thing that investors have left to ponder is this: will the November, 2008 lows hold. I really think it is that simple.
It appears that prices are headed to those lows, and we should see the obligatory test and bounce. These lows should be bought by investors as this is what traders will be doing, and for those with a longer term perspective, this could represent an opportunity of a lifetime as stocks are on sale and likely be supported by value hunters.
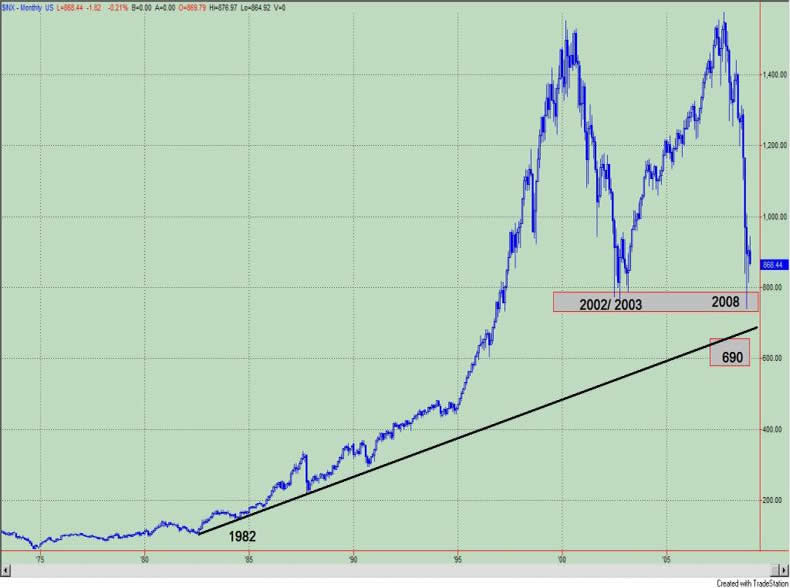
Figure 1 is a monthly chart of the S&P500. The double bottom between the 2002/ 2003 lows and the 2008 lows is easily seen. What if the recent lows don't hold? Then I can see prices trading down to the very long term trend line drawn from the 1982 lows. This corresponds to about 690 on the S&P500.
Figure 1. S&P500/ monthly
Now all this is going to take time, and the longer the better. Figure 2 is a monthly chart of the S&P500, and the indicator in the lower panel is our "next big thing" indicator, which seeks to quantify technical factors seen at secular trend changes. Our current trend is bearish, and the indicator continues to rise suggesting that the potential for a bottom is months away. I say "potential" because the indicator only identifies when a trend change is likely; technical factors (i.e., a moving average crossover or some such other metric) are used for confirmation of a trend change. As you can see from the figure, this indicator has done a good job at identifying the bottoms seen 1974, 1978, 1982 and 2002. What did these bottoms have in common? They tended to be associated with high volatility and a sudden reversal of prices.
Figure 2. S&P500/ monthly
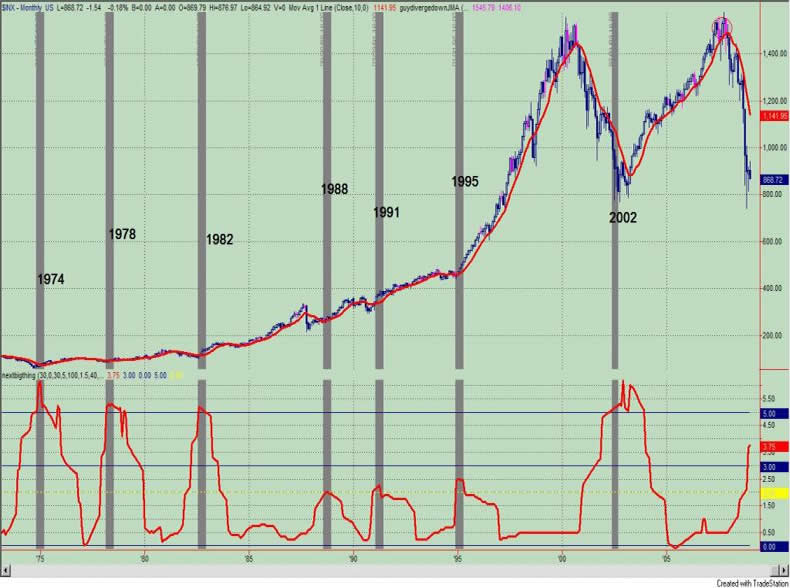
The bottoms seen in 1988, 1991, and 1995 are all noteworthy because the "next big thing indicator" didn't reach extremes levels seen in past bottoms. However, these bottoms (1988, 1991, and 1995) are low volatility bottoms and came about due to a prolong period of base building. In the current market enviroment, this kind of base building would take months of sideways price action.
I recently looked at another method of determining "When We Can Expect A Sustainable Price Move" , and I came to a similar conclusion. If prices on theS&P500 traded at their average price over the past 2 months, it would take about 8 months before prices closed above the 200 day moving average.
Once again, it is all about time and there is no escaping the time factor.
By Guy Lerner
http://thetechnicaltakedotcom.blogspot.com/
Guy M. Lerner, MD is the founder of ARL Advisers, LLC and managing partner of ARL Investment Partners, L.P. Dr. Lerner utilizes a research driven approach to determine those factors which lead to sustainable moves in the markets. He has developed many proprietary tools and trading models in his quest to outperform. Over the past four years, Lerner has shared his innovative approach with the readers of RealMoney.com and TheStreet.com as a featured columnist. He has been a regular guest on the Money Man Radio Show, DEX-TV, routinely published in the some of the most widely-read financial publications and has been a marquee speaker at financial seminars around the world.
© 2009 Copyright Guy Lerner - All Rights Reserved
Disclaimer: The above is a matter of opinion provided for general information purposes only and is not intended as investment advice. Information and analysis above are derived from sources and utilising methods believed to be reliable, but we cannot accept responsibility for any losses you may incur as a result of this analysis. Individuals should consult with their personal financial advisors.
Guy Lerner Archive |
© 2005-2022 http://www.MarketOracle.co.uk - The Market Oracle is a FREE Daily Financial Markets Analysis & Forecasting online publication.