


Stock Market Mega-trend Super-cycle Wave IV
Stock-Markets / Elliott Wave Theory Jan 10, 2009 - 11:55 AM GMTBy: Joseph_Russo

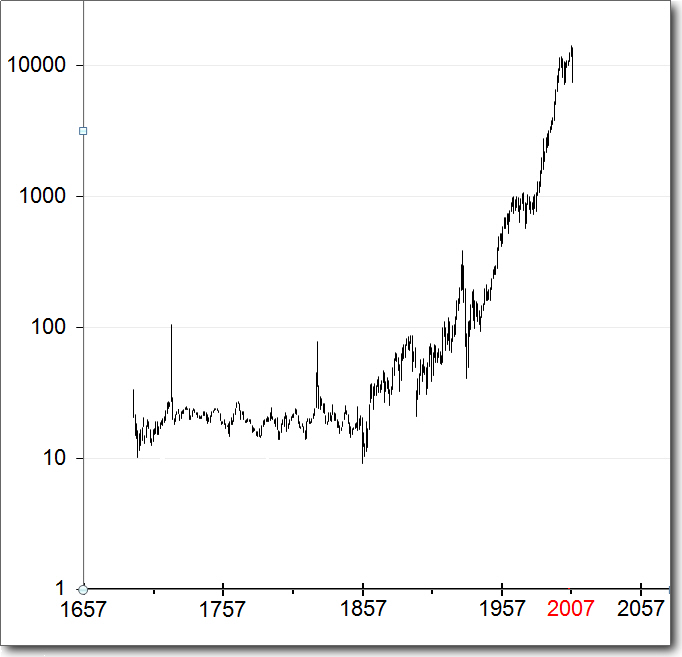
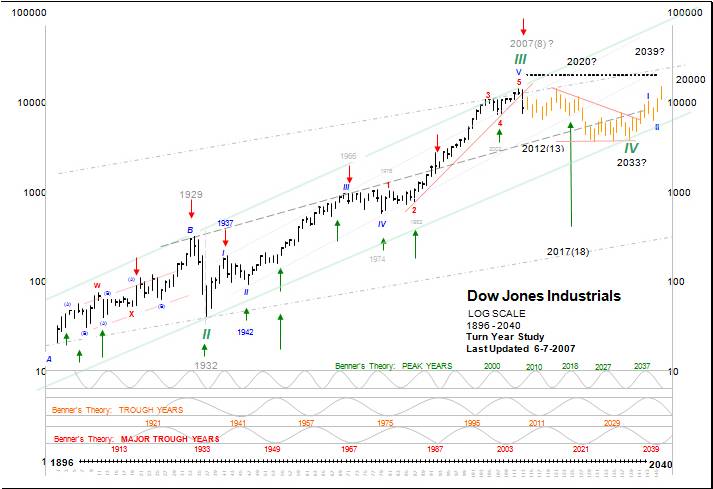
 Working out the largest of Big-Picture Visions - The equity price-chart below is a compilation of data points starting with the British All shares Index (1693-1853), the Clement Burgess Index (1854-1895), and then spliced using ratio multipliers with the Dow Jones Industrial Average from 1896 to present. The 315-year result is the longest contiguous record of equity prices in the history of Humankind.
Where are we?
Placing a cogent wave count to this data from a long-term grand cyclical Elliott Wave perspective is no easy task. Even the most astute of Elliott Wave analysts would pause at the challenge in assigning the wave labels inherent at each of the nine degrees of trend defined by Mr. Elliott. The first 164-years of price-data is enmeshed with a series of sharp spikes, massive crashes, along with an endless array of corrective overlapping bull and bear market waves in between. Such patterns present daunting challenge to reconcile. It is not until the print low in 1932 that we are able to identify a clear visual five-wave upward impulse.
At first glance, one would be inclined to label the 1693-1857 consolidation as some type of gargantuan fourth wave event. This would suggest that the present day crest might be marking our “end of days”. Though this is plausible, we have arrived at an alternate, more optimistic longer-term opinion. Despite our long-view optimism, there is no feasible way for long-term “buy & hold” investors to avoid the carnage and consequence of Super-Cycle Wave IV.
View from the far corners of the Universe
From the far corners of the Universe, this is how one with eternal life might view the last 315-years of humankind's progress. It is from this perspective that we postulate the vertical parabolic rise from 1857 as an unequivocal third wave of significant import.
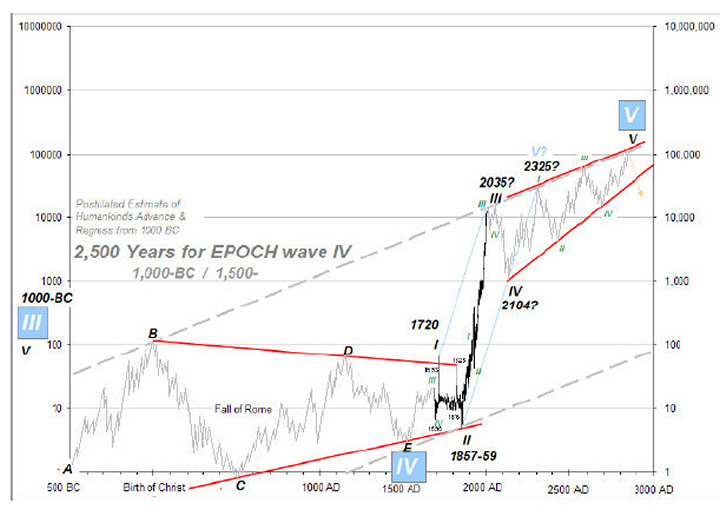
Grand-Super-Cycle wave II (1720-1857) 137-years
Super-Cycle wave III (1932-2007) 75-years
(Extended) Cycle-Wave V (1974-2007) 34-years
When the above chart first appeared on our screen, the first thing we thought was –
“HOLY COW that is Log Scale!”
Let us put this Big-Picture exercise in some context.
Consider for a moment that a fifth-wave Elliott terminal at Grand Super Cycle Degree will be an event of magnitude relative to the stability or very existence of humankind. A 40- foot rise in the Sea level, an Asteroid Impact, a Nuclear Accident, a worldwide Pandemic, or Gamma Rays from a nearby star going Super Nova come to mind as events associated with terminal of a Grand Fifth. Yes, we are talking about the extinction of Humankind or worse. In this context, we optimistically hope that we have at least another thousand years to get things right before such reckoning may befall us. The planet has been around for a long time, and so has Humankind. As death and taxes are certain, so too is it certain that the planet will someday explode at the hand of a dying star some 93-million miles away.
Returning to optimism, look at that 164-year never-ending, (plausibly perceived) potential Grand-Four Triangle discussed (at first glance) relative to the chart above. With this unique compressed view of the “really big picture”, that span of 164-years can easily appear as first and second waves, especially considering the utter absurdity of the parabolic rocket launch off the 1857-59 low. Viewed at such scale, if we are on the doorstep of our last days, such an imminent Grand Fifth ending would seem rather short lived given all that is behind us. Short of a MAJOR world-changing event, placed in this context, one can only assume that the insane parabolic advance we are witnessing is that of an extended Third Wave of Grand-Super-Cycle-Degree. Those gurus' once clamoring for a 30-thousand Dow may not be so crazy after all however; those 100,000 Dow folks may have to wait a thousand years for validation.
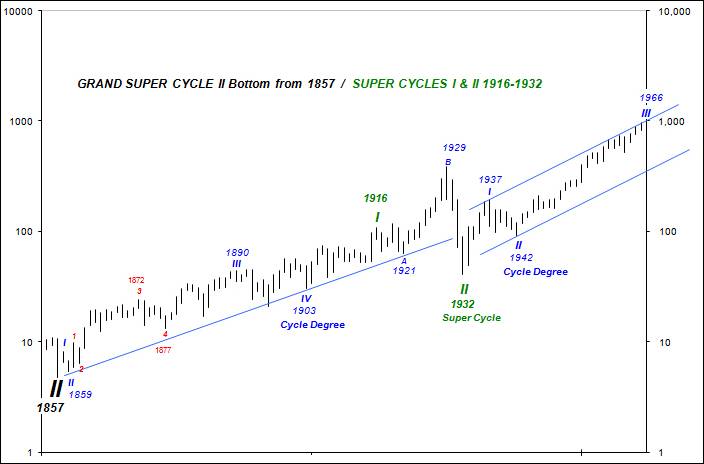
The 1932 Crash Low registers Super-Cycle II
Elliott himself remained strident that the '29 print high was an expanded “B” wave of sorts. That he considered it that of Cycle Dimension as we now do, is not likely. Of particular interest in reconciling the above two sets of Cycle-Degree impulses from 1857-1966, are the extraordinary Fibonacci turn sequences taking place between most all of our yearly terminals.
For Example:
From the 1857 low, a primary degree bull crested some (34-1) 33-years later in 1890 marking a Cycle-Degree III wave peak. Our positioning of the 1903 Cycle Degree IV takes place 13-years later following the 1890 III-wave crest.
Enter, the Federal Reserve
Just three years following the establishment of the US Federal Reserve system, our proprietary 1916 Super-Cycle I tops amid a 13-year long Cycle-Degree V wave advance, which disappointingly does not contain a visual impulse. Five years of bear market decline then marks our Cycle Degree “A” wave in 1921, followed by an 8-year relentless bubble, which fatally burst at the phony “B” wave crest of Cycle Dimension in 1929.
Thereafter, three years of Fibonacci carnage wreaked havoc, bringing on the Great Depression as it marks our Super-Cycle II terminal. Five years of bull market respite then crested the widely accepted Cycle Degree wave-I peak in 1937. Also widely accepted, the Cycle Wave II low of 1942 marked another five-year Fibonacci bear market prior to launching a most impressive bull market run before hitting the 1000-level brick wall at its Cycle III-wave ceiling in 1966. The answering bear market of Cycle Wave IV-wave down would not end for another eight years at the print low of 1974. After 8 years of struggle, the Dow blasted off from a secondary higher base in 1982 and barely looked back.
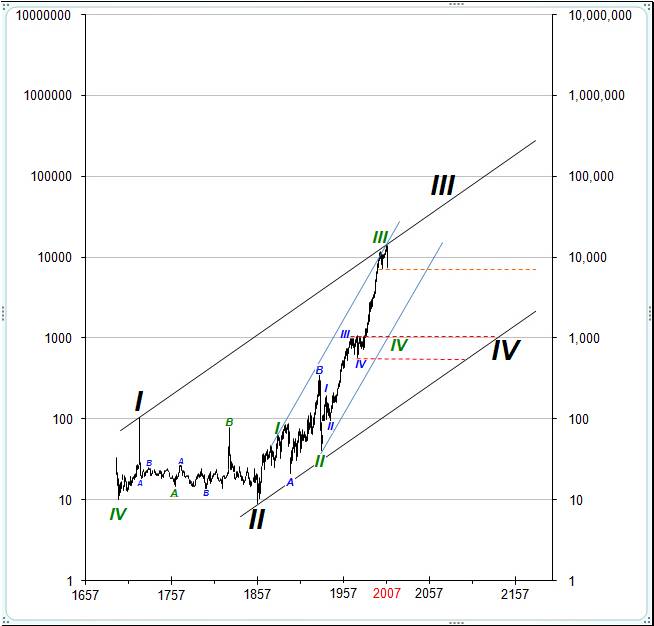
Some (34-1) 33-Fibonacci years post the 1974 low, 2007 has clearly marked high terminal to Super-Cycle III. Given such a rich and reliable history of reference imparted by Mr. Elliott and Fibonacci, what may Super-Cycle wave-IV have in store?
We've only just begun
Should our wave counts prove accurate we may eventually refer to the correction we have seen thus far, as the calm-before- the- storm. Should Elliott's tendency for alternation hold true to form, Super Cycle wave-IV possesses the capacity to implode the Dow back toward its former brick wall at the 1000 level, and do so in fairly short order.
In the year 2525 – if “man” is still alive
Our chart below, prepared for subscribers back in June of 2007 (and still holding true to forecast), depicts a kinder gentler SC-IV-wave consolidation lasting well beyond 2525.
Choose your poison –All at once, or prolonged torture
Though there is no way to tell with certainty the precise duration, depth, and shape of SC-IV, we did know well in advance that such a decline would likely be arriving in the 2007-2008 time frame. What we can prepare for is one of the two general outcomes mentioned above. One is a hard, fast, painful crash of historic proportion, and the second is a long, drawn-out agonizing torture comprised of a series of smaller cyclical bull and bear markets. Either way involves a significant amount of pain for long-term buy & hold investment strategies.
Counting the vast array of explosive subdivisions amid Super-Cycle IV
To track and trade the currently unfolding subdivisions of SC-IV effectively, one may subscribe to our premium technical publication. The express focus of Elliott Wave Technology's Near Term Outlook is to help active traders anticipate price direction and amplitude of broad market indices over the short, intermediate, and long-term.
Over the past three years, we have perfected the art of dispatching tactical trade set-ups and market forecasting to a consistent, impartial, and immensely profitable endeavor for those who take the time to embrace it. We deliver this unique blend of proprietary charting protocol daily, with the express intent to convey timely and profitable information. Our daily reports impart strategy-specific guidance , which strives to forecast, monitor, and calibrate market impact relative to a multitude of trading signals that are in direct alignment with eight distinct strategies set forth in the members NTO essentials file.
Regardless of one's level of trading experience, users must allow sufficient time to become acquainted with the authors charting protocol, strategies, and tactical narratives prior to entering positions or developing discretionary trading strategies of their own. Our forthcoming E-letters should assist greatly in this endeavor.
Essential E-Letters on tap for 2009:
How to Buy Critical Bottoms, Sell Major Tops, and Trade the Swings in between
To more effectively convey dynamic trading conditions relevant to our technical publications; we are soon planning to launch complimentary E-letter briefings for our clients. E-letter dispatches will briefly summarize tactical trading postures across various time horizons and trading strategies. They will simplify big-picture core positions, as well as recap the logic and challenges surrounding short and medium term trading efforts. Best of all, we intend to provide these confidence building letters FREE to all who wish to receive them. The theme of our maiden E-letter will reveal how to sell at major tops, buy at critical bottoms, and how to trade all of the intermittent swings. Those interested may email us to get an early seat on our mailing list.
Trade Better / Invest Smarter...
By Joseph Russo
Chief Editor and Technical Analyst
Elliott Wave Technology
Email Author
Copyright © 2009 Elliott Wave Technology. All Rights Reserved.
Joseph Russo, presently the Publisher and Chief Market analyst for Elliott Wave Technology, has been studying Elliott Wave Theory, and the Technical Analysis of Financial Markets since 1991 and currently maintains active member status in the "Market Technicians Association." Joe continues to expand his body of knowledge through the MTA's accredited CMT program.
Joseph Russo Archive |
© 2005-2022 http://www.MarketOracle.co.uk - The Market Oracle is a FREE Daily Financial Markets Analysis & Forecasting online publication.