


Credit Crisis Watch: Credit Market Freeze Continues to Thaw
Interest-Rates / Credit Crisis 2008 Dec 24, 2008 - 10:57 AM GMT

 Are the various central bank liquidity facilities and capital injections having the desired effect of unclogging credit markets and restoring confidence in the world's financial system? This is precisely what the “Credit Crisis Watch” is all about – a regular review of a number of measures in order to ascertain to what extent the thawing of credit markets is under way.
Updating the report at this time is also to gauge the credit markets' reaction to the Federal Open Market Committee's (FOMC) announcement of a week ago about a Fed funds rate cut and specific actions that would move the Fed further towards a quantitative easing approach to monetary policy. (Also see my “ Words from the Wise ” review.)
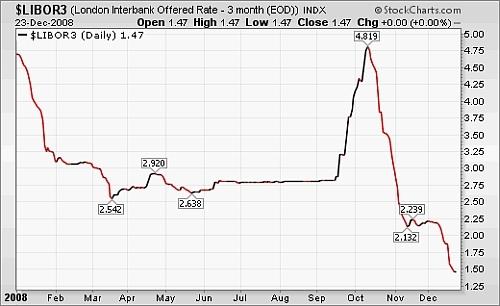
With the US and some other countries pushing monetary policy into an era of Zirp (zero-interest-rate policy), the three-month dollar LIBOR interest rate that banks charge each other declined sharply to 1.47%. At this level, LIBOR trades at 122 basis points above the upper end of the Fed funds' target range – still steep compared to the 43 basis-point premium at the start of 2008.
Source: StockCharts.com
Importantly, US three-month Treasury Bills are still yielding almost nothing (0.015%) and are simply a way for nervous investors to “warehouse” their money with safety while receiving no return.
US three-month Treasury Bill yield
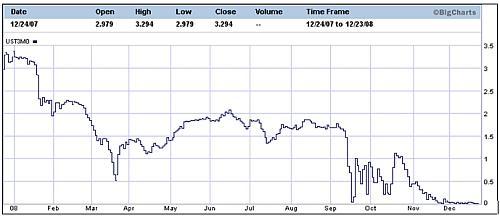
Source: The Wall Street Journal
The TED spread (i.e. three-month dollar LIBOR less three-month Treasury Bills) is a measure of perceived credit risk in the economy. This is because T-bills are considered risk-free while LIBOR reflects the credit risk of lending to commercial banks. An increase in the TED spread is a sign that lenders believe the risk of default on interbank loans (also known as counterparty risk) is increasing. On the other hand, when the risk of bank defaults is considered to be decreasing, the TED spread narrows.
Since the TED spread's peak of 4.65% on October 10, the measure has eased to 1.46% – a level last seen prior to the Lehman bankruptcy in September.
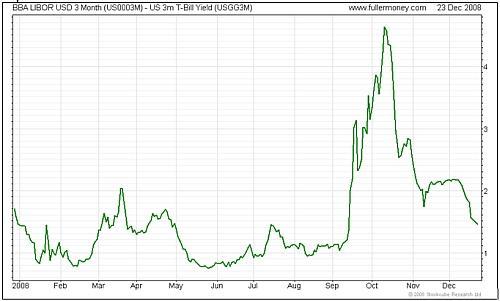
Source: Fullermoney
The difference between the LIBOR rate and the overnight index swap (OIS) rate is another measure of credit market stress.
When the LIBOR-OIS spread increases, it indicates that banks believe the other banks they are lending to have a higher risk of defaulting on the loans, so they charge a higher interest rate to offset that risk. The opposite applies to a narrowing LIBOR-OIS spread.
Similar to the TED spread, the narrowing in the LIBOR-OIS spread over the past few weeks is also a move in the right direction.
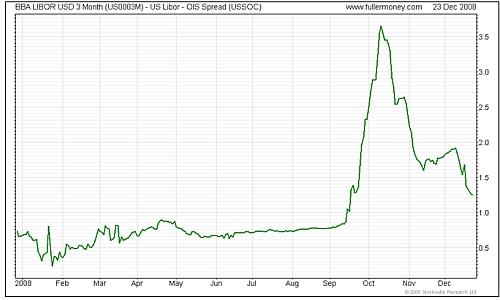
Source: Fullermoney
“Even although the rates at which banks lend to each other have eased from their peaks, banks have cut back significantly on the amount of money they are actually lending,” said Eoin Treacy ( Fullermoney ). The US Depository Institutions Aggregate Excess Reserves continue to skyrocket far in excess of the amount that banks need to keep on deposit to meet their reserve requirements (see chart below). This measure indicates that the balance sheets of banks remain under pressure, especially in view of the fact that the value of some assets is not known. A peak in the Excess Reserves graph should coincide with a turning point in the recovery of banks.
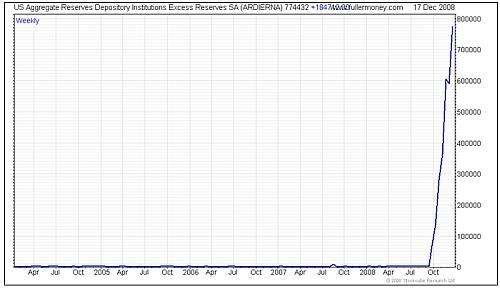
Source: Fullermoney
Not illustrated by a chart, the spreads between ten-year Fannie Mae and other Government Sponsored Enterprise (GSE) bonds and ten-year US Treasury Notes have also tightened significantly over the past few weeks.
The average rates for a US 30-year fixed mortgage declined by the end of last week to 5.19 from 6.30% at the beginning of November. However, the rate is still 372 basis points higher than the three-month dollar LIBOR rate. According to Bloomberg , this spread averaged 97 basis points during the 12 months preceding the crisis, indicating that lower rates are not being passed on to consumers.
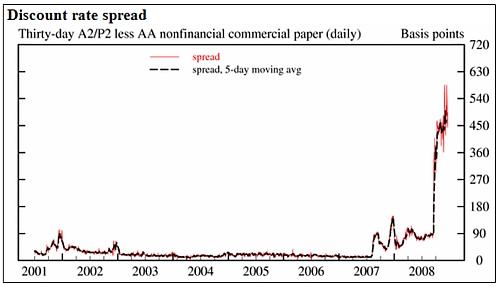
As far as commercial paper is concerned, the A2P2 spread measures the difference between A2/P2 (low quality) and AA (high quality) 30-day non-financial commercial paper. The spread remains at an elevated level of 4.91%, indicating a crisis environment.
Source: Federal Reserve Release – Commercial Paper
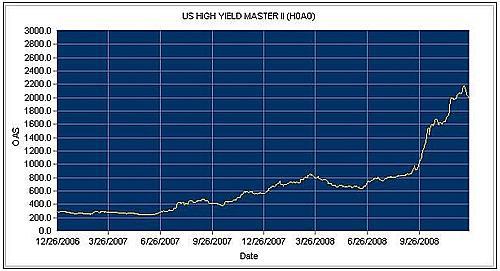
Similarly, junk bond yields remain at high levels, as shown by the Merrill Lynch US High Yield Index. However, a slight decline of 200 basis points has taken place since the Index's record high of 2,182 on December 15. This means the spread between high-yield debt and comparable US Treasuries was 1,982 basis points by the close of business on Tuesday. With the US 10-year Treasury Note yield at 2.18%, high-yield borrowers have to pay 22.00% per year to borrow money for a ten-year period. At these rates it is practically impossible for companies with a less-than-perfect credit status to conduct business profitably.
Source: Merrill Lynch Global Index System
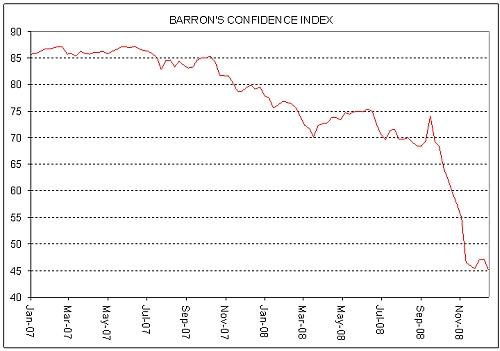
Another indicator worth keeping an eye on is the Barron's Confidence Index. This Index is calculated by dividing the average yield on high-grade bonds by the average yield on intermediate-grade bonds. The discrepancy between the yields is indicative of investor confidence. A declining ratio indicates that investors are demanding a higher premium in yield for increased risk. The Index is at an all-time low, indicating a lack of confidence in the economy.
Source: I-Net Bridge
According to Markit , the cost of buying credit insurance for US, European, Japanese and other Asian companies has improved solidly over the past month, as shown by the tighter spreads (expressed in basis points) for the five-year credit derivative indices listed in the table below.
The notable exception has been the Markit iTraxx Europe Crossover Index, made up of 50 mostly high-yield companies, that has widened considerably on rising expectations of bond defaults among junk-grade names. The increase of 93 basis points in the Crossover spread means an increased cost of €93,000 (up from €915,000 to €1,008,000) to insure €10 million of debt annually over five years.
• CDX (North America, investment-grade) Index: down from 267 to 211
• CDX (North America, high-yield) Index: down from 1,546 to 1,233
• Markit iTraxx Europe Index: down from 183 to 181
• Markit iTraxx Europe Crossover Index: up from 915 to 1,008
• Markit iTraxx Japan Index: down from 350 to 295
• Markit iTraxx Asia ex Japan IG Index: down from 452 to 347
• Markit iTraxx Asia ex Japan HY Index: down from 1,375 to 1,263
The graphs of the CDX indices are shown below, with the red line indicating the spreads easing over the past month.
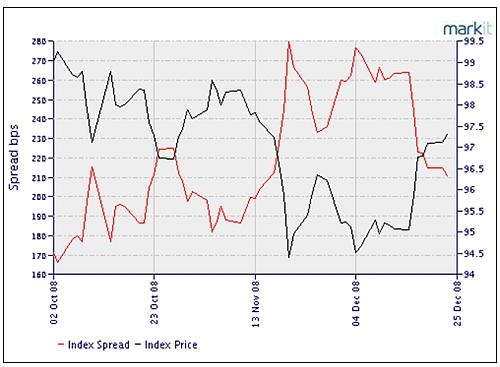
Source: Markit
CDX (North America, high-yield) Index
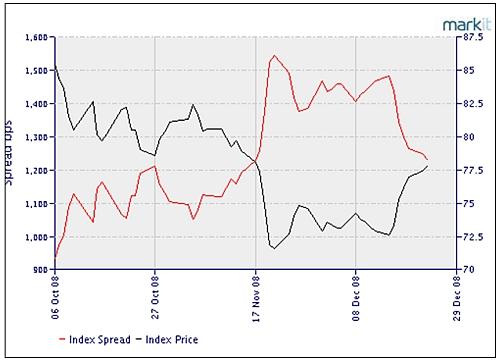
Source: Markit
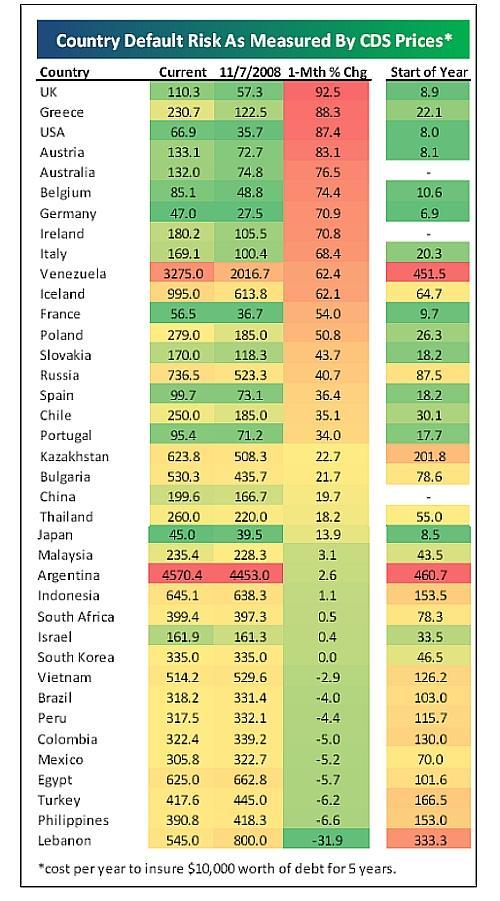
Next, some credit default swap (CDS) statistics, courtesy of Bespoke . Since a month ago the cost of insuring against government bankruptcy through CDSs has risen for all but nine countries in Bespoke's list of 38 countries. The table below shows the current CDS prices, together with month-ago and start-of-year prices.
Argentina, Venezuela and Iceland have the highest default risk. Interestingly, Germany, Japan and France all have a lower default risk than the US at the moment. It now costs $67 per year to insure $10,000 against US default for the next five years. “While this may not seem high, it was at $8 earlier in the year, and $36 one month ago,” said Bespoke.
As shown in Bespoke's table below, the UK, Greece, the US, Austria and Australia have seen default risk rise the most over the last month. Notably, the US has risen by 87%.
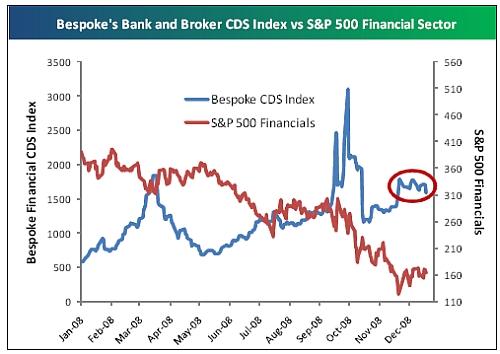
Still on the issue of CDSs, over the past week Bespoke 's Bank and Broker default risk index has declined by 6%, while it has dropped by 11.5% over the past month. A decline in the financial sector's default risk is a necessary requirement for an improvement in confidence.
In summary, the TED spread, LIBOR-OIS spread and GSE mortgage spreads have narrowed markedly since the recent record highs. Furthermore, the CDX and iTraxx credit derivative indices have mostly shown a solid improvement over the past few weeks. However, US Treasury Bills and high-yield spreads are still at distressed levels.
Although the Fed and other central banks' actions have resulted in some progress being made to fix the broken credit machine, the thawing of the credit markets still has a considerable way to go before liquidity starts to move freely and the world's financial system functions normally again.
Did you enjoy this post? If so, click here to subscribe to updates to Investment Postcards from Cape Town by e-mail.
By Dr Prieur du Plessis
Dr Prieur du Plessis is an investment professional with 25 years' experience in investment research and portfolio management.
More than 1200 of his articles on investment-related topics have been published in various regular newspaper, journal and Internet columns (including his blog, Investment Postcards from Cape Town : www.investmentpostcards.com ). He has also published a book, Financial Basics: Investment.
Prieur is chairman and principal shareholder of South African-based Plexus Asset Management , which he founded in 1995. The group conducts investment management, investment consulting, private equity and real estate activities in South Africa and other African countries.
Plexus is the South African partner of John Mauldin , Dallas-based author of the popular Thoughts from the Frontline newsletter, and also has an exclusive licensing agreement with California-based Research Affiliates for managing and distributing its enhanced Fundamental Index™ methodology in the Pan-African area.
Prieur is 53 years old and live with his wife, television producer and presenter Isabel Verwey, and two children in Cape Town , South Africa . His leisure activities include long-distance running, traveling, reading and motor-cycling.
Copyright © 2008 by Prieur du Plessis - All rights reserved.
Disclaimer: The above is a matter of opinion and is not intended as investment advice. Information and analysis above are derived from sources and utilizing methods believed reliable, but we cannot accept responsibility for any trading losses you may incur as a result of this analysis. Do your own due diligence.
Prieur du Plessis Archive |
© 2005-2022 http://www.MarketOracle.co.uk - The Market Oracle is a FREE Daily Financial Markets Analysis & Forecasting online publication.