


Watching for Good U.S. Stock Market Entry Points
Stock-Markets / Stock Market Valuations Dec 10, 2008 - 02:39 PM GMTBy: Richard_Shaw

 We are waiting watchfully for a good re-entry point for US equities using the substantial cash position we raised last summer.
The critical factors we are watching to identify a prudent re-entry point — information we will use to become comfortable that the storm we avoided has passed by — are:
- Technical Market Factors
- Valuation Fundamentals
- Risk Levels
- Government Intervention Policies
- Economic Conditions
Economic conditions are poor and the time frame to recovery still seems longer than the 6-12 months that the markets are generally assumed to discount in advance. Q4 earnings reports may be telling.
Government intervention policies are not yet fully established or implemented. Unkowns abound with respect to Congressional action on several fronts, ranging from possible 4.5% new mortgages to auto company bailouts. A new president and cabinet plan some sort of massive stimulus package that has yet to be defined and debated. We need to wait until January or February to begin to get good clarity on that. Foreign government and supra-national agency (e.g. IMF) policies are continuing to be announced. Eventually, if enough money is applied to the problems, reflation of economies will happen, but what will happen between then and now, and how long it will take to get to the other side, is not yet clear.
Risk levels are still extraordinary. Michael Santoli wrote in this week's Barron's about research published by Vince Farrell as follows: “Since 1950, over a span of nearly 15,000 trading days, the Standard & Poor's 500 has gained or lost 4% or more in a day only 68 times (33 down, 35 up). Of those 68 days, 28 have occurred in the past three months.” We think that is a clear indication of the abnormally high current risk level.
Valuation fundamentals are opaque, but probably unfavorable. While P/E ratios are average or slightly below, the “E” is still coming down. Dividends are still being cut. Congress is still talking about prohibiting dividends by companies receiving bailout money. Business failures are still rising. The possible economic collapse due to bank failures has been replaced by possible economic collapse due to auto company failures. Basic materials costs have already collapsed due to lack of manufacturing demand. Key economies in China and India are still growing, but the rate of growth is falling.
Technical factors for the asset categories we are watching are mixed. We are monitoring ten bellwether asset categories as macro level representations of the larger world of investment assets (asset type / proxy fund):
- US Stocks (VTI)
- Non-US Developed Market Stocks (EFA)
- Emerging Market Stocks (EEM)
- US Real Assets (VNQ)
- Global Commodities (DJP)
- US Aggregate Bonds (AGG)
- US Treasuries 7-10 Years (IEF)
- US Dollar Index (UUP)
- Crude Oil (USO)
- Gold Bullion (GLD)
Simple, short-term candlestick charts for each of the asset category proxy funds shows some categories doing well, some doing badly and some trying to do better.
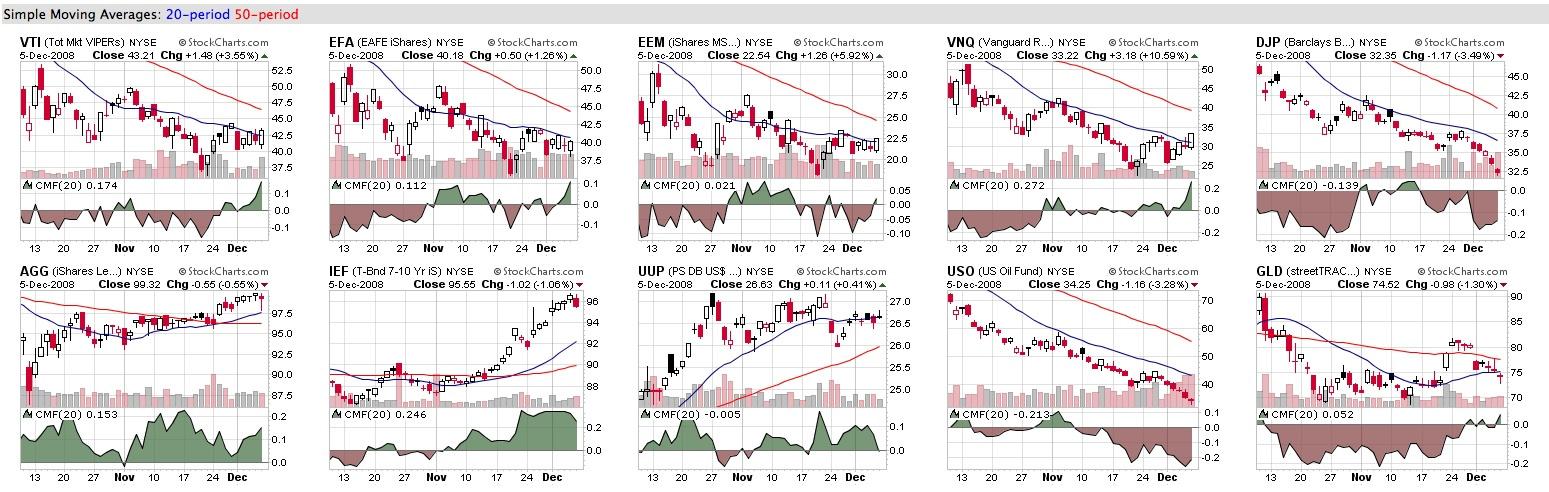
AGG, IEF and UUP are strong. USO and DJP are doing badly. VTI, EFA, EEM, VNQ, and GLD are trying to do better.
From a rotation perspective, we do have some concerns about Treasuries (IEF) and the Dollar (UUP). When risk appetites return, rotation out of Treasuries to riskier bonds or stocks will likely depress Treasury prices. Also when the trillions of new Treasury issuance take place to fund the bailout, Treasury prices may fall to compensate buyers for the risks they are asked to assume. Similarly, the Dollar may have strengthened in great part due to the rush to the liquidity and relative safety of Treasuries. The Dollar is strong, but there are questions about how long that can last as questions about the US economy persist and with historically low short-term interest rates.
For now, bond allocations are doing mostly OK.
Closer Look at US Stocks:
Let's take a closer look at US stocks as represented by the S&P 500 index. We are looking at VTI (total US stocks) generally, but the S&P 500 has a longer history, which makes it better for long-term historical views.
The top level technical issue is establishing the major trend as up, down or sideways. The time frame used to determine trends depends on investment time horizon. Just to cover all the bases for different prospective investors, let's look at a wide time range — 27 years, 3 years, 1 year, and 3 months.
The charts that follow have some annotations identifying some potentially interesting attributes of the charts patterns.
The 10-year Treasury bond interest rate is plotted on the same space as the S&P index levels (right scale for S&P index, and left scale for Treasury yield). The charts also present simple moving averages as overlays of the index levels, and present price and volume oscillators that variously indicate money flow, momentum, direction and extreme conditions (overbought and oversold).
The charts use these indicators in the panels below the price chart panel (descriptions adapted from John Murphy's www.StockCharts.com)
- Average Directional Index (ADX): ADX (a bounded oscillator) indicates the strength of a current trend whether up or down. It is an oscillator that fluctuates between 0 and 100. Readings above 60 are relatively rare. Low readings, below 20, indicate a weak trend and high readings, above 40, indicate a strong trend. The indicator does not grade the trend as bullish or bearish, but merely assesses the strength of the current trend regardless of direction.
- Relative Strength Index (RSI): RSI (a bounded oscillator) compares the magnitude of gains to the magnitude of losses, and expresses the calculation as a number within a band from 0 to 100. It does not measure strength relative to another security, but rather measures the strength of directional moves by a single security. It is useful for identifying extreme conditions (movements too far, too fast in either up or down direction) called “overbought” (typically over 70) and “oversold” (typically under 30).
- Moving Average Convergence/Divergence (MACD): MACD (an unbounded, centered oscillator) uses three moving averages to indicate direction and momentum. It subtracts a longer moving average from a shorter moving average creating a line that oscillates around a center at zero with no upper or lower limits. The third and shortest moving average moves around the oscillator to serve as a signal line when it crosses the oscillating line.
- Chaikin Money Flow (CMF): CMF (an unbounded oscillator) evaluates the cumulative flow of money into and out of a security. It establishes a point value for the closing price position within the period's price range, then multiples that by the volume for the period and then maintains a running total for the selected number of periods.
- The Money Flow Index (MFI): MFI (a bounded oscillator) is a momentum indicator that is similar to RSI in both interpretation and calculation (with a range from 0 to 100), except that it is volume-weighted. It compares “positive money flow” to “negative money flow” to reflect the momentum of money flowing in and out of a security.
S&P 500 Monthly from 1981
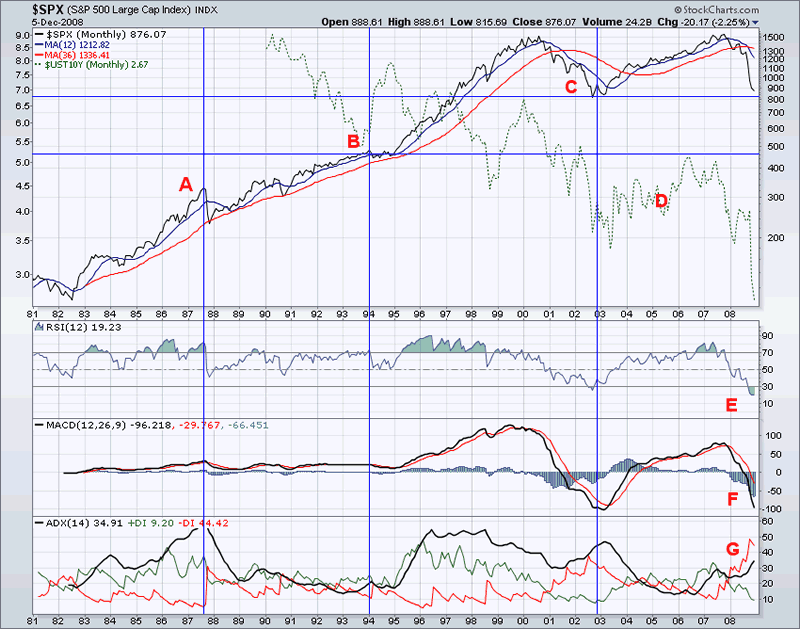
(A) the October 1987 crash is the only period in the last 27 years that visually resembles the price change since September.
(B) the point in 1994 where HTML was introduced to enable internet images — when the internet took off and so did the dot.com bubble.
(C) the 2002-2003, post dot.com, post 9/11 bottom which appears to be a potential bottom level for the current market (a possible “support” level)
(D) the yield on 10-year Treasury bonds
(E) RSI showing a potentially oversold current condition
(F) MACD showing negative momentum and no sign of a reversal
(G) ADX showing a moderately strong trend, which the price chart visually shows as downward.
S&P 500 Montly for 3 Years
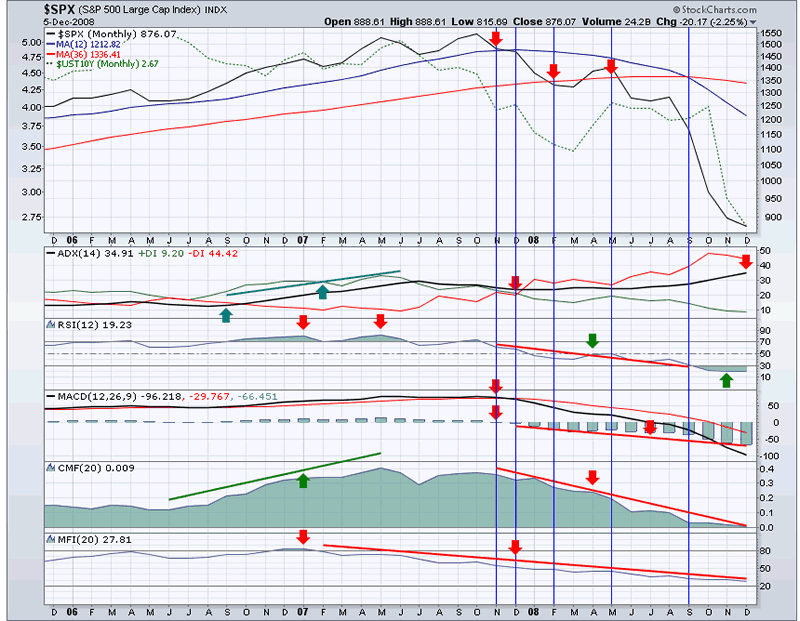
Red and green arrows highligting some points at which down (red) indications were present, and at which up (green) indicators were present.
S&P 500 Weekly for 1 Year
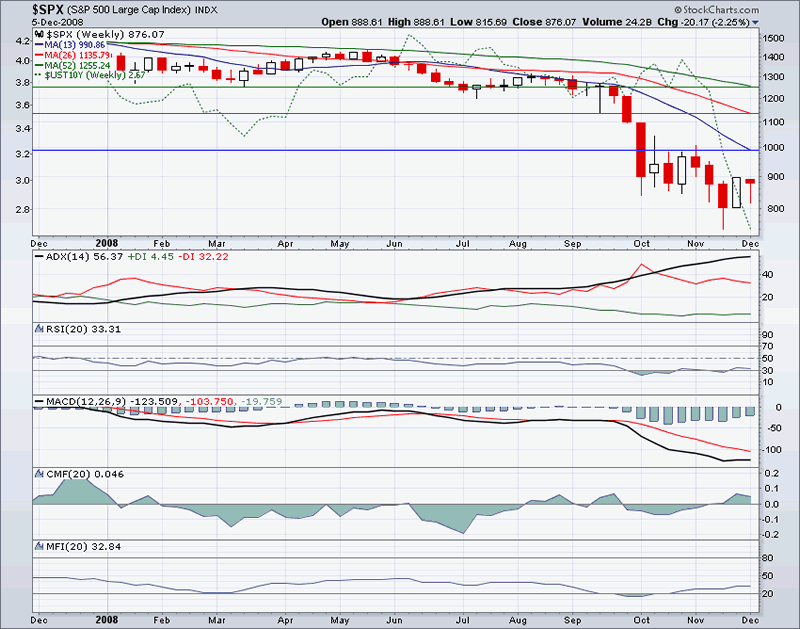
Horizontal lines emphasize the current values of the 13-week, 26-week and 52-week simple moving averages (”SMA”) which may be “attractors” for the price in a reversion to mean scenario.
S&P 500 Daily for 3 Months
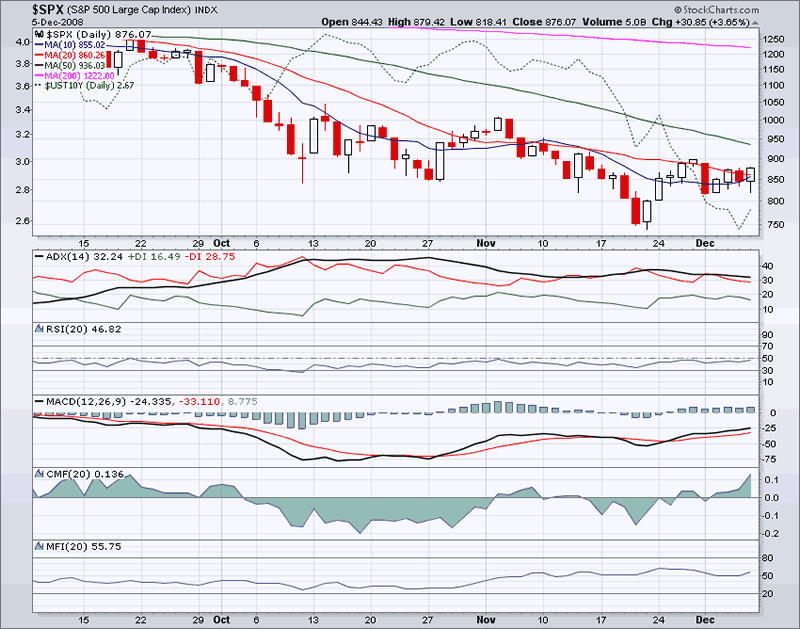
The 10-day SMA is about to make a bullish cross of the the 20-day SMA, but it made such a cross in early November, only for the price to fall shortly thereafter. There were big government intervention surprises back then, but there may be at this time too — GM, Ford and Chrysler. The 20-day, 50-day and 200-day SMA's are downward tilted, which is still bearish. ADX says trend is moderate but weakening — possibly a pre-positive sign. RSI is so-so. MACD made a bullish cross-over in late November, but it did that in early November too. CMF Money flow has turned as positive as it was in September, before the big market crack. MFI money flow momentum has been increasing in November, but is not in an extreme condition.
Third Party View:
Market Edge Second Opinion is a technical service that uses multiple technical criteria. They rate our ten bellwether asset categories as follows (”+” means improving and “-” means worsening — our short hand for Market Edge's more complete explanation):
- AVOID (+): US Stocks (VTI)
- NEUTRAL (+): Non-US Developed Market Stocks (EFA)
- NEUTRAL (+): Emerging Market Stocks (EEM)
- AVOID (-): US Real Assets (VNQ)
- AVOID (-): Global Commodities (DJP)
- NOT RATED: US Aggregate Bonds (AGG)
- NOT RATED: US Treasuries 7-10 Years (IEF)
- LONG (-): US Dollar Index (UUP)
- AVOID (-): Crude Oil (USO)
- LONG (-): Gold Bullion (GLD)
Summary:
No matter the assessment, each investor has their own risk tolerance, future financial sources, liabilities and investment time horizon. It is impossible to say what everyone should do, because we are all different. You need to make your own assessment of your situation, the market conditions and probable futures.
Generally, it looks to us as if the markets are trying to behave in a hopeful manner, perhaps in recognition that governments are determined to fix things up, but with a backdrop of terrible economic conditions, uncertain timing of uncertain outcomes, at a time when risk of absolute loss due to default and bankruptcy and risk of violent value fluctuations are front and center.
You, or you and your advisor, must decide where in the risk spectrum you should insert your money. Are you a 25-year old “early saver”? Are you a gambler by nature? Are you a “prudent man”? Are you done saving to increase your portfolio and now nurturing it for the long term? If you lost 20% would your life style be compromised? If you lost 50% could you maintain your lifestyle? Do you have specific liabilities for which you should protect matching assets? Are you a non-profit or other organization with investment guidelines or restrictions? Can you sleep at night with the risks you have or are thinking about taking? These are some of the kinds of questions you need to answer before you decide what to do and when.
By Richard Shaw
http://www.qvmgroup.com
Richard Shaw leads the QVM team as President of QVM Group. Richard has extensive investment industry experience including serving on the board of directors of two large investment management companies, including Aberdeen Asset Management (listed London Stock Exchange) and as a charter investor and director of Lending Tree ( download short professional profile ). He provides portfolio design and management services to individual and corporate clients. He also edits the QVM investment blog. His writings are generally republished by SeekingAlpha and Reuters and are linked to sites such as Kiplinger and Yahoo Finance and other sites. He is a 1970 graduate of Dartmouth College.
Copyright 2006-2008 by QVM Group LLC All rights reserved.
Disclaimer: The above is a matter of opinion and is not intended as investment advice. Information and analysis above are derived from sources and utilizing methods believed reliable, but we cannot accept responsibility for any trading losses you may incur as a result of this analysis. Do your own due diligence.
Richard Shaw Archive |
© 2005-2022 http://www.MarketOracle.co.uk - The Market Oracle is a FREE Daily Financial Markets Analysis & Forecasting online publication.