


Gold Price Upside Breakout Whilst Crude Oil Continues to Slide Lower
Commodities / Gold & Silver Nov 24, 2008 - 12:36 AM GMTBy: Chris_Vermeulen

 Shining gold prices & gold stocks and slippery Oil prices and energy stocks
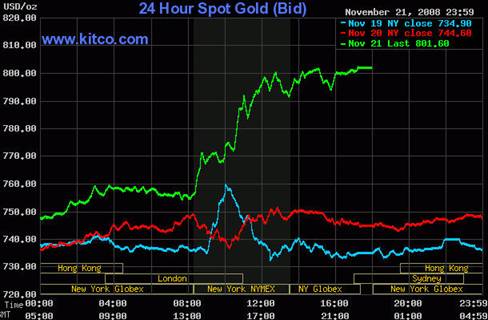
Gold prices shot up on Friday as investor's move their money into a safer investment as the broad market continued it crash the day before breaking the October bottom. Once the price of gold climbed over the $760 mark which was a short term resistance level the price shot higher as new buyers jumped in and short covering took place pushing gold to climb $57 in one day which you can see in the chart below.
Spot Gold Prices – 3 Day Intraday Chart
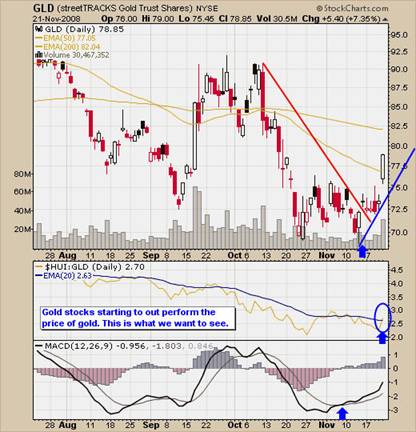
Now, looking at the daily chart of gold below, it appears that it has put in a double bottom with a nice rally higher. Also confirming this move may not be over yet is the MACD cross over and the strength of gold. Its best to waiting for a low risk setup before any money should be put to work. We are getting close to possible buy signals if things continue to hold up over the next week or so. Gold will find resistance between $800 - $825 and could take a breather for a few days which could provide a great setup if we are lucky.
Daily GLD Gold Price Chart
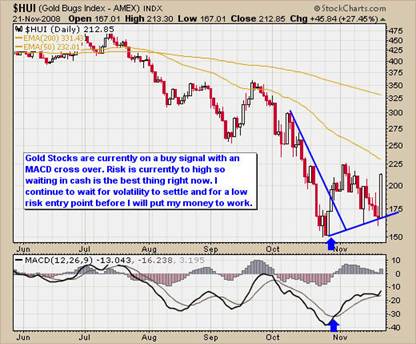
Gold stocks shine as they rally big on Friday out performing the price of gold and possibly putting in a higher low for the HUI which could be the start of an upward trend. Keeping a close eye on the performance of gold stocks will help confirm a low risk setup for trading gold (GLD, DGP, and Spot Gold). If gold stocks are performing well during a gold buy signal I generally put more money to work on that trade as opposed to gold stocks underperforming the price of gold.
Daily Gold Bugs Chart (Gold Stocks)
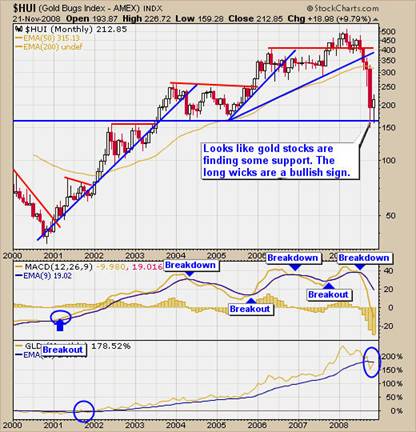
A longer term look at gold stocks performance which is shown in the chart below is the fact that they are bouncing off long term support which has been tested 5 times. This is very bullish for gold and gold stocks as well.
Monthly Gold Stock Chart
Slippery Oil Prices
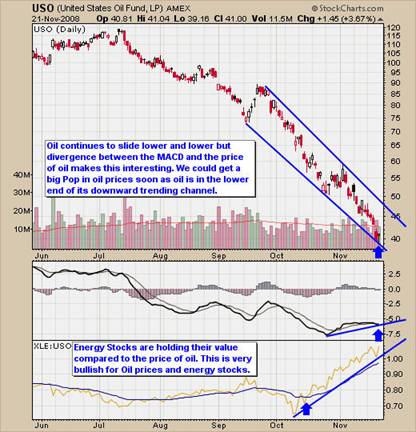
Oil Traders cannot believe the slide in oil since June this year. Last Thursday oil closed below $50 which is a long ways of its $150 high not to long ago. A couple interesting things show up on my oil chart which I thought are worth pointing out. Obviously the price of oil is severely oversold and due for a dead cat bounce if not a “V” shaped bottom. But although prices continue to slide the momentum is starting to shift to the up side. The MACD is trying to move higher which is a good thing and also the fact that oil is at the bottom of it channel. Also energy stocks are out performing the price of oil like crazy!!! This is extremely bullish and a bounce in oil will send energy stock soaring. I will note that a lot of energy stocks pay a dividend and with their share prices being pushed down to these extreme levels, investors are starting to buy because the dividend rate is so high and most of these companies make solid earning year after year so at these prices the shares look attractive to many.
Oil Trading Chart (USO)
Conclusion:
I don't try to predict market direction because it's a fools game, I do think we have some exciting times just around the corner if the market does find support in the next week or so. I have been in cash since August waiting for a setup but volatility is ridiculously high and I don't put my money to work if I'm risking more than 3% on a trade. Gold Stocks are starting to have money flow back into them and oil is starting to look like its downward move is almost exhausted. I continue waiting for a proper setup with low risk as I believe in taking the safe middle section of trends and not trying to pick tops or bottoms.
I am a full time daytrader and swing trader specializing in trading GLD, GDX, XGD.TO, SLV and USO. I provide my trading charts, market insight and trading signals to members of my newsletter service.
By Chris Vermeulen
Chris@TheGoldAndOilGuy.com
Please visit my website for more information. http://www.TheGoldAndOilGuy.com
Chris Vermeulen is Founder of the popular trading site TheGoldAndOilGuy.com. There he shares his highly successful, low-risk trading method. For 6 years Chris has been a leader in teaching others to skillfully trade in gold, oil, and silver in both bull and bear markets. Subscribers to his service depend on Chris' uniquely consistent investment opportunities that carry exceptionally low risk and high return.
This article is intended solely for information purposes. The opinions are those of the author only. Please conduct further research and consult your financial advisor before making any investment/trading decision. No responsibility can be accepted for losses that may result as a consequence of trading on the basis of this analysis.
Chris Vermeulen Archive |
© 2005-2022 http://www.MarketOracle.co.uk - The Market Oracle is a FREE Daily Financial Markets Analysis & Forecasting online publication.