


Housing Market Heads South and S&P 500 Crashes Through Bear Market Low!
Housing-Market / Financial Crash Nov 23, 2008 - 05:25 PM GMT

 Mike Larson writes: Last Thursday was a historic day for the market. The Standard & Poor's 500 Index plunged by 6.7% to 752.44. The bear market low of October 2002 was 768.63 — and we sliced through it like a hot knife through butter.
Stated another way, every last penny of profit an investor earned — even if he bought at the absolute low six years ago has been wiped off the map. And if you bought the S&P just over a year ago? You've lost more than HALF your money.
Martin and I wished these days would never come. But we did not allow those hopes to deter us from predicting them. Indeed, just a few short months ago — in our Safe Money Report and here in Money and Markets — we warned that the market would AT LEAST fall to its 2002 lows. Now that has happened.
Why? All the powerful forces we have been warning you about have converged in one time and one place. The slumping economy. The debt market crisis. Huge financial sector losses. Crashing corporate earnings. And most importantly, a deepening crisis in housing.
Speaking of which … everyone knows the housing market is hurting. I've been talking about a meltdown scenario for more than three years. And unfortunately, many of my warnings have come true.
What you may NOT be aware of, though, is just how suddenly — and how severely — the market has downshifted … AGAIN. The very latest, hot-off-the-presses numbers are so amazingly bad … so horrendous … that I wanted to make sure they didn't get lost in the clutter.
Indeed, if you're trying to buy or sell a house, or if you're an investor who owns any stock even tangentially tied to the housing market, you need to know what's going on.
Housing Disaster #1: Builder Confidence, Buyer Traffic Falling off the Table
Every month, the National Association of Home Builders (NAHB) surveys builders on the front lines of the industry. It asks them about sales, buyer traffic, and expectations about the future. And then it produces indices that sum up the results. Get a load of what the November numbers showed …
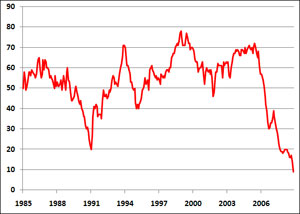 |
| In November, the NAHB builder's confidence index hit its lowest level … ever. |
- The overall index plunged to 9 in November from 14 in October. Not only is that a 36% decline — in just one month — it also leaves the NAHB index at the lowest level ever (the data goes back to 1985).
- Among the sub-indices, the one that tracks current single family home sales dropped to 8 from 14 … the one measuring expectations about future sales held steady at a record low of 19 … and the one measuring prospective buyer traffic fell to 7 from 11. In other words, the details of the report are just as ugly as the headline.
- Regionally, builders couldn't catch a break. The Northeast index dropped to 11 from 16, the Midwest index slumped to 7 from 13, the South index fell to 11 from 16, and the West index plunged to 6 from 11. There was no sign of strength anywhere in the country.
Bottom line: Anyone looking for a glimmer of hope for the housing market won't find it in the latest figures. Builders are universally gloomy about the state of their business across all regions of the country. Readings on buyer traffic and current sales fell sharply, while expectations for future sales held at their record low from October.
The credit crunch is part of the problem. But so too is the broad deterioration we've seen in the U.S. economy in recent months. Some consumers can't afford to buy homes because they can't access mortgage financing or because they have lost their jobs. Others don't want to purchase because they're worried home prices will fall further.
Housing Disaster #2: Purchase Loan Applications Plunge
Most buyers don't pay cash to purchase homes. They take out mortgages. So naturally, the volume of applications for loans to buy homes can be used as a LEADING indicator of future home sales. And the news there points to shockingly bad future sales.
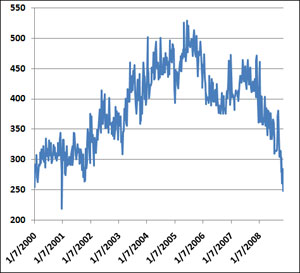 |
| The MBA's weekly loan index shows that the demand for mortgages is drying up. |
The Mortgage Bankers Association's (MBA) weekly purchase loan index plunged 12.6% in the week of November 14. At 248.50, it's the lowest since the week of December 29, 2000.
Now here's the thing: The MBA figures do some crazy things around the holidays. You often see big increases and big decreases in the weeks around Christmas and New Year's because of the difficulty of seasonally adjusting the figures. For example, the 12/29/00 week I mentioned above showed a 21.4% drop in purchases … but the week of 1/5/01 showed a 33.9% rise.
If you EXCLUDE the December 2000 spike down to adjust for that fact, you'd have to go all the way back to … another holiday week, the week of 12/31/99, to find a lower reading. And if you exclude THAT holiday-distorted number, you won't find a lower purchase applications reading since March 1999 — almost a decade ago!
Bottom line: Demand for home purchase mortgages is drying up. That means home sales are going to take another big leg down.
Housing Disaster #3: Home Construction, Building Permit Issuance Hits Lowest Level in Recorded U.S. History
The Census Bureau began tracking home construction and building permit issuance in 1960. Back then, Dwight Eisenhower was the president of the U.S. … the book “To Kill a Mockingbird” was first published … and the Dow Jones Industrial Average began the year trading at 679.35.
And according to the latest numbers, the housing industry is now building fewer American homes than it was back then. The full details
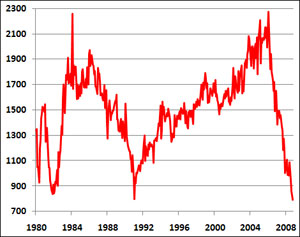 |
| In October, housing starts hit their lowest level in recorded history. |
- In October, housing starts were running at a seasonally adjusted annual rate of 791,000. That was down 4.5% from September, down 38% from the year-earlier reading, and down 65.2% from the January 2006 peak. This is the lowest level in recorded U.S. history.
- Building permit issuance is a future indicator of construction activity. After all, you can't build a house until you've pulled a permit. In the month of October, permitting activity plunged even more than housing starts — down 12.1% to 708,000 units at a seasonally adjusted annual rate. That's a whopping 40.1% off the year-ago level, down 68.7% from the September 2005 peak, and also the lowest level ever found.
- Breaking it down by property type, single-family starts dropped 3.3% to 531,000. Multi-family starts dropped 6.8% to 260,000. Single-family permitting activity dropped 14.5% to 460,000, while multi-family permitting dropped 7.1% to 248,000.
Lower construction activity is necessary to bring supply back in line with demand. And builders have made some progress in reducing new home inventory for sale.
But with unemployment on the rise, mortgage credit harder to get, and the broad economy slowing, housing demand is sliding. That should necessitate an even lower level of starts — hard to imagine given that we are already seeing the lowest level of activity in recorded U.S. history.
Quit listening to the Pollyannas — Listen to the DATA
I've been hearing “bottom” calls on housing for the greater part of the past two years from the Pollyannas on Wall Street and in Washington. Every single one has proven to be wrong … dead wrong. And this latest data tells a very grim tale.
Indeed, every single indicator — starts, permits, mortgage purchase applications, builder confidence — indicates that the already struggling industry has taken a header in the past couple of months.
So if you're looking to buy a house, drive a hard bargain. You definitely have the upper hand.
If you're looking to sell, be realistic. The market stinks. You have to price your property accordingly.
And if you're holding stocks in the construction sector, the mortgage lending sector, or any other sector tied to building and lending, what are you waiting for? If you didn't listen to my initial, urgent “sell” recommendations more than three years ago, get the heck out now!
Until next time,
Mike
This investment news is brought to you by Money and Markets . Money and Markets is a free daily investment newsletter from Martin D. Weiss and Weiss Research analysts offering the latest investing news and financial insights for the stock market, including tips and advice on investing in gold, energy and oil. Dr. Weiss is a leader in the fields of investing, interest rates, financial safety and economic forecasting. To view archives or subscribe, visit http://www.moneyandmarkets.com .
Money and Markets Archive |
© 2005-2022 http://www.MarketOracle.co.uk - The Market Oracle is a FREE Daily Financial Markets Analysis & Forecasting online publication.